Time Series Plots Explainations
The International GNSS (Global Navigation Satellite System) Network -- the IGS network --
is made of a set of ground tracking stations across the world. These sites collect a variety of data, including its position, over a long period of time,
changing in response to shifts in the tectonic plate. These changes in position are measured and transmitted to one or more analysis centers around the world:
COD: Center for Orbit Determination (Switzerland)
ESA: European Space Agency (Germany)
GFZ: GeoForschungsZentrum (Germany)
GRG: Space Geodesy Team of the CNES (France)
JPL: Jet Propulsion Laboratory (United States)
MIT: Massachusetts Institute of Technology (United States)
NGS: National Geodetic Survey (United States)
SIO: Scripps Institute of Oceanography (United States)
The CMB analyses is a combination of all available analyses and is a good starting point to gain familiarity with the data.
Each of these centers analyze the same raw data with their own individual processes to obtain a graphic summary displayed on a time scale. These time series
plots are displayed within this section of the website.
Click "Select Station" to see and navigate to a list of all stations!
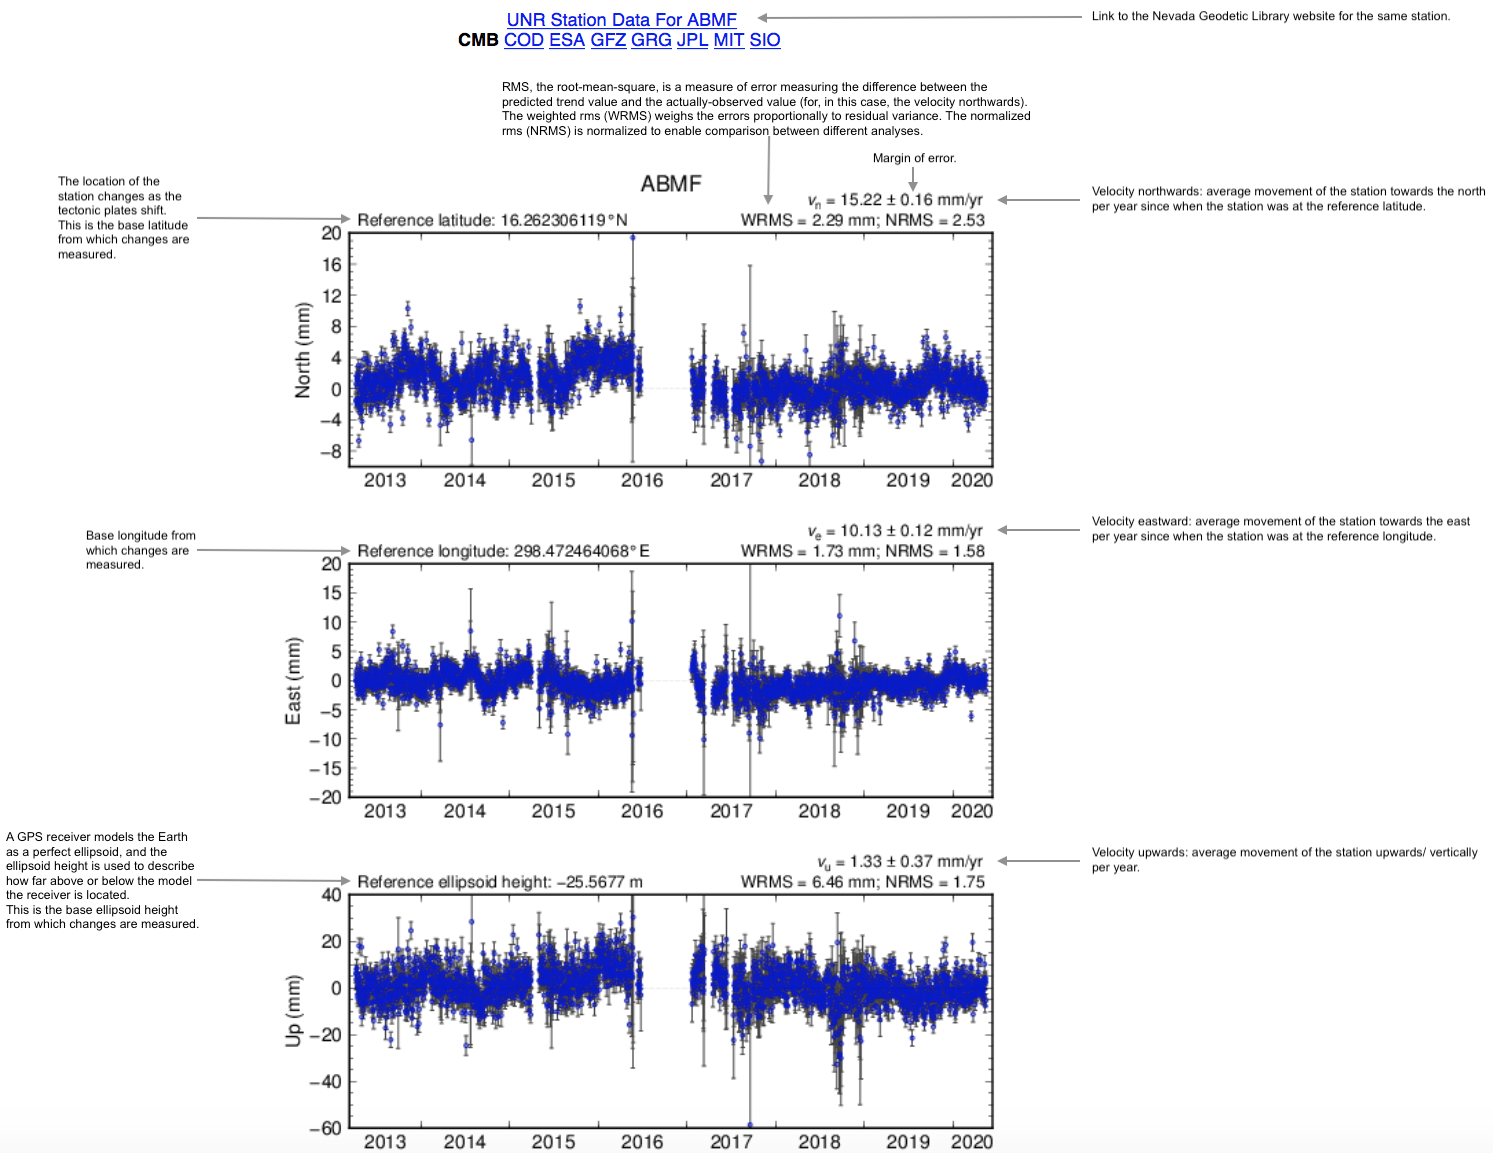
See an explanation of one example station -- station ABMF -- below.