| Site | JPL | SIO | Combined times series | ||
|---|---|---|---|---|---|
| North | East | Height | |||
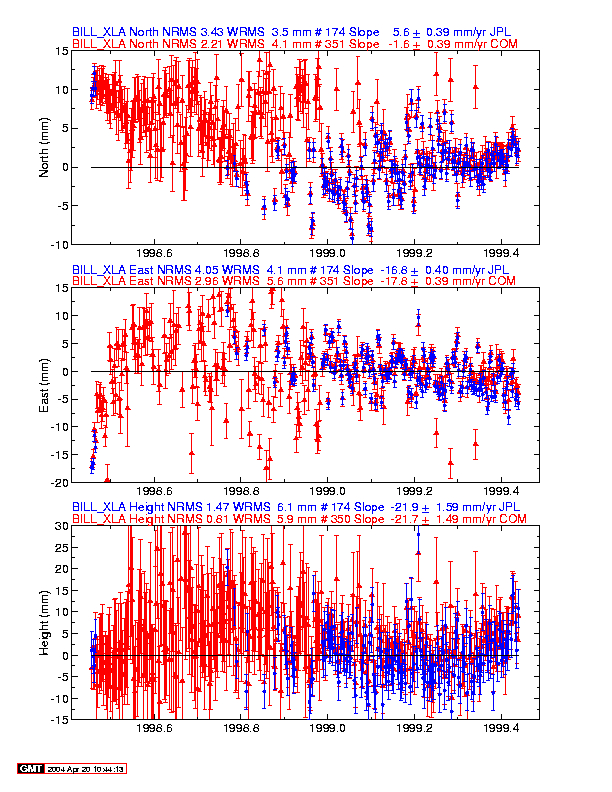
| 1 BILL_XLA | BILL_XLA_jpl.jpg | BILL_XLA_sio.jpg | N | E | U |
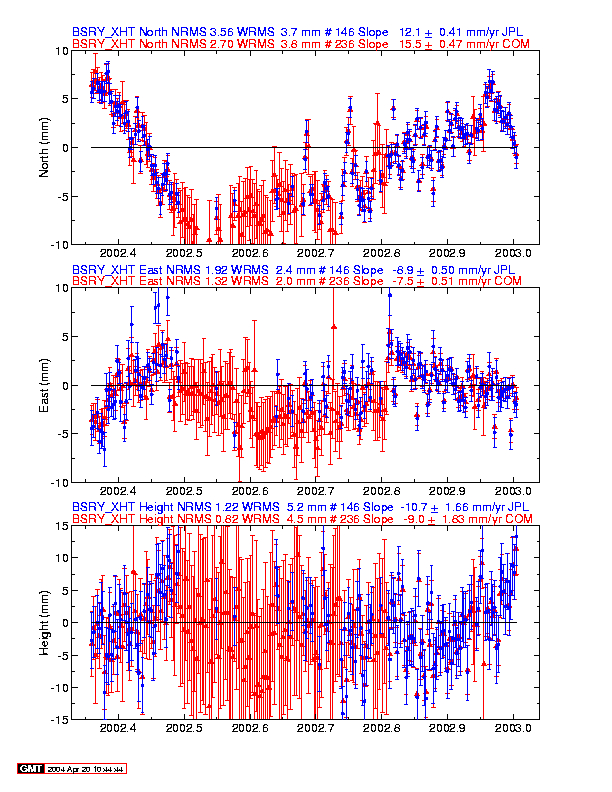
| 2 BSRY_XHT | BSRY_XHT_jpl.jpg | BSRY_XHT_sio.jpg | N | E | U |
| 3 CAT1_XHT | NA | CAT1_XHT_sio.jpg | N | E | U |
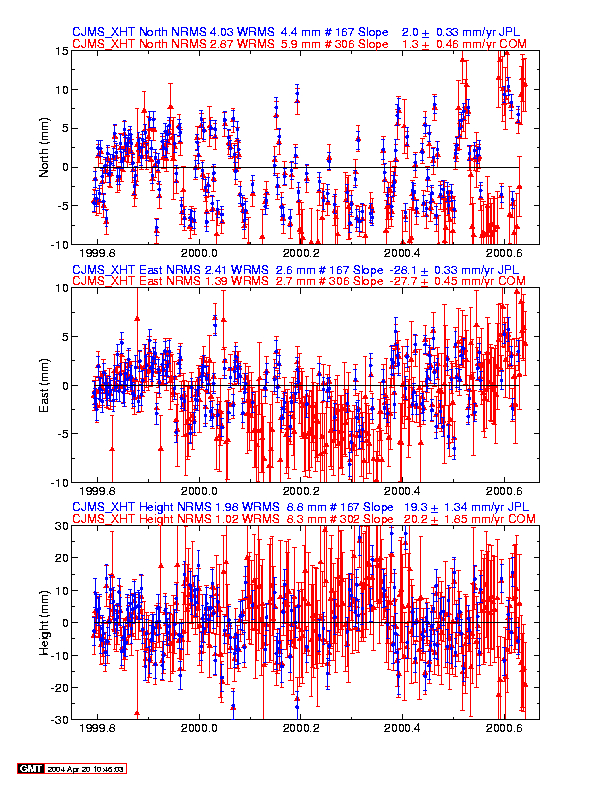
| 4 CJMS_XHT | CJMS_XHT_jpl.jpg | CJMS_XHT_sio.jpg | N | E | U |
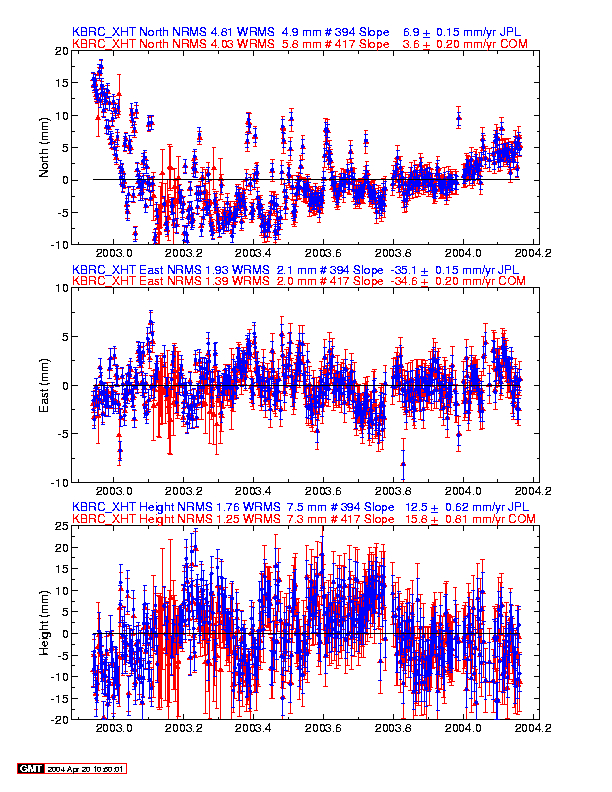
| 5 KBRC_XHT | KBRC_XHT_jpl.jpg | KBRC_XHT_sio.jpg | N | E | U |
| 6 MUSB_XLA | NA | MUSB_XLA_sio.jpg | N | E | U |
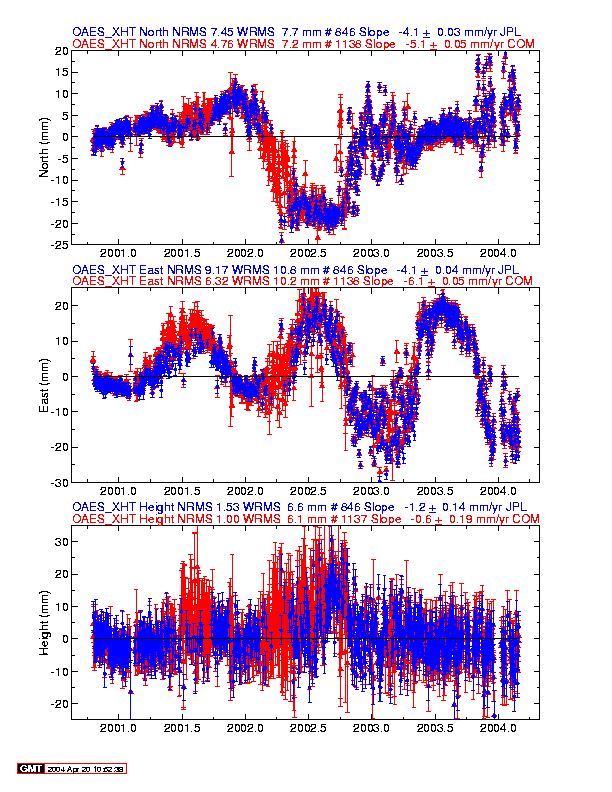
| 7 OAES_XHT | OAES_XHT_jpl.jpg | OAES_XHT_sio.jpg | N | E | U |
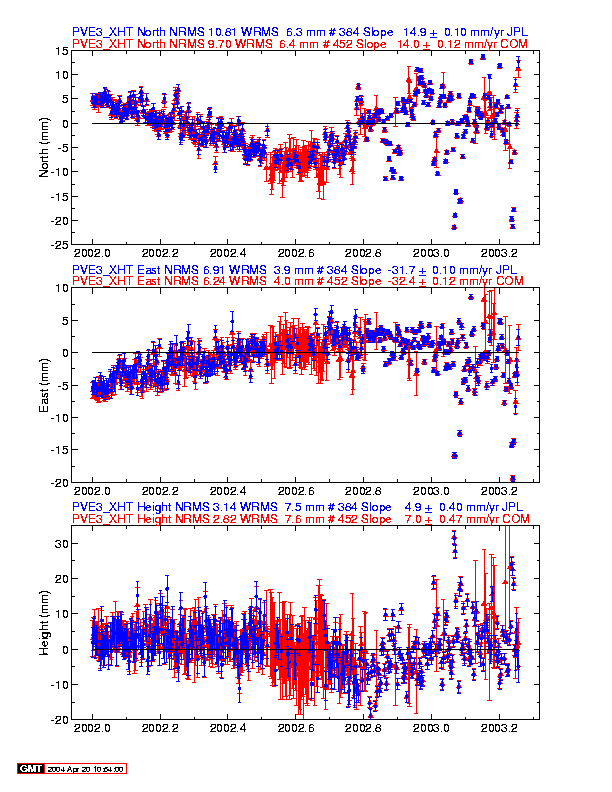
| 8 PVE3_XHT | PVE3_XHT_jpl.jpg | PVE3_XHT_sio.jpg | N | E | U |
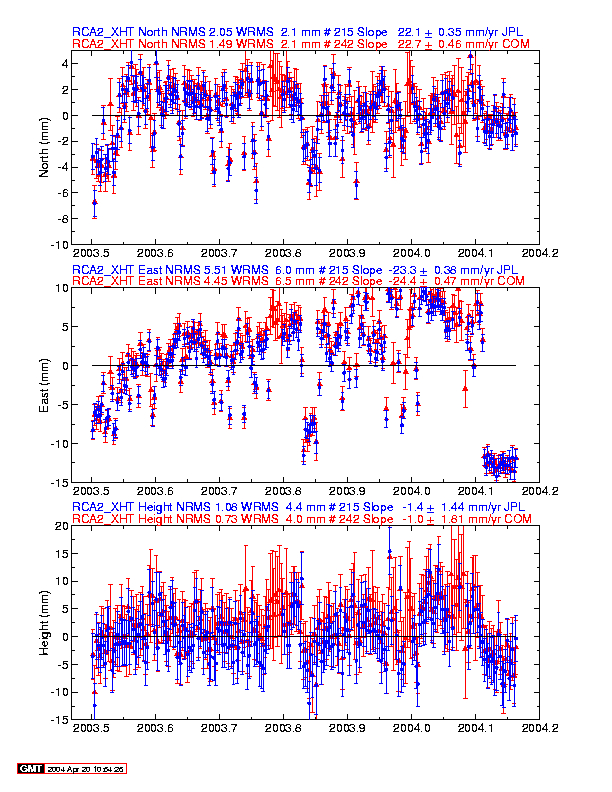
| 9 RCA2_XHT | RCA2_XHT_jpl.jpg | RCA2_XHT_sio.jpg | N | E | U |
| 10 RTHS_XNR | NA | RTHS_XNR_sio.jpg | N | E | U |
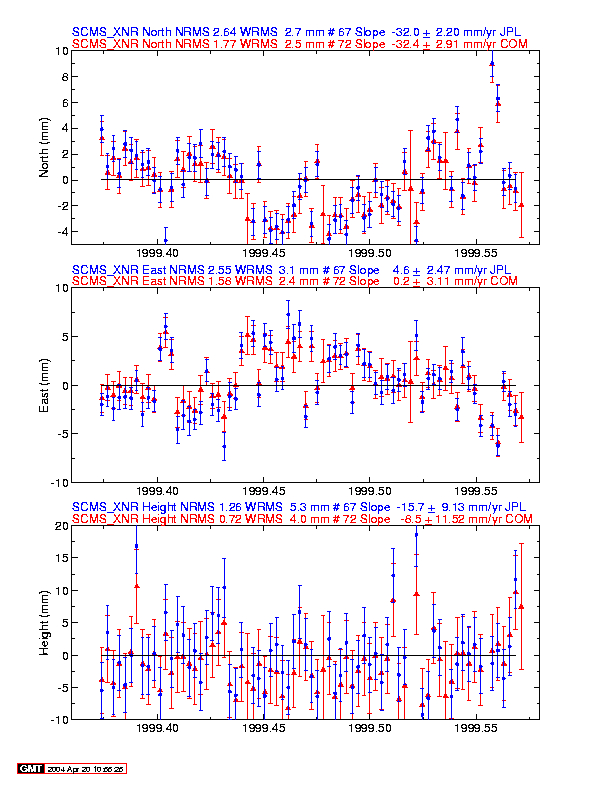
| 11 SCMS_XNR | SCMS_XNR_jpl.jpg | SCMS_XNR_sio.jpg | N | E | U |
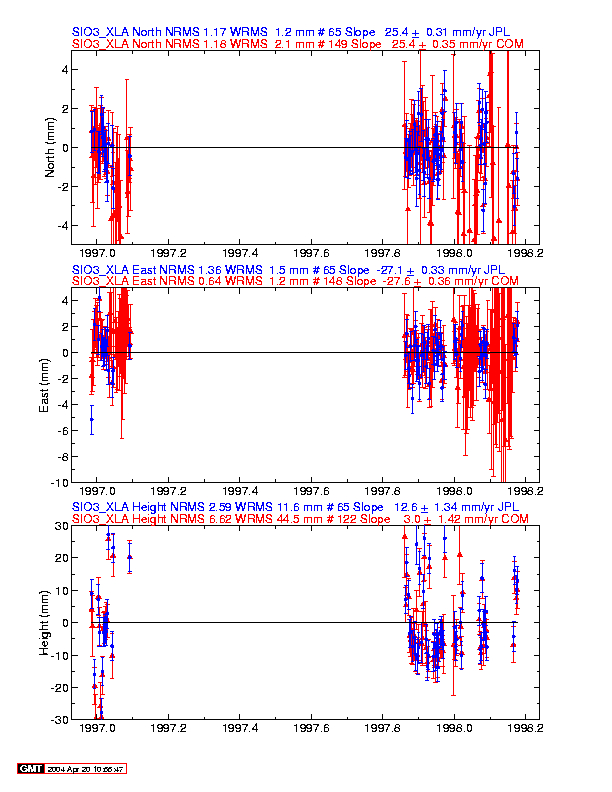
| 12 SIO3_XLA | SIO3_XLA_jpl.jpg | SIO3_XLA_sio.jpg | N | E | U |
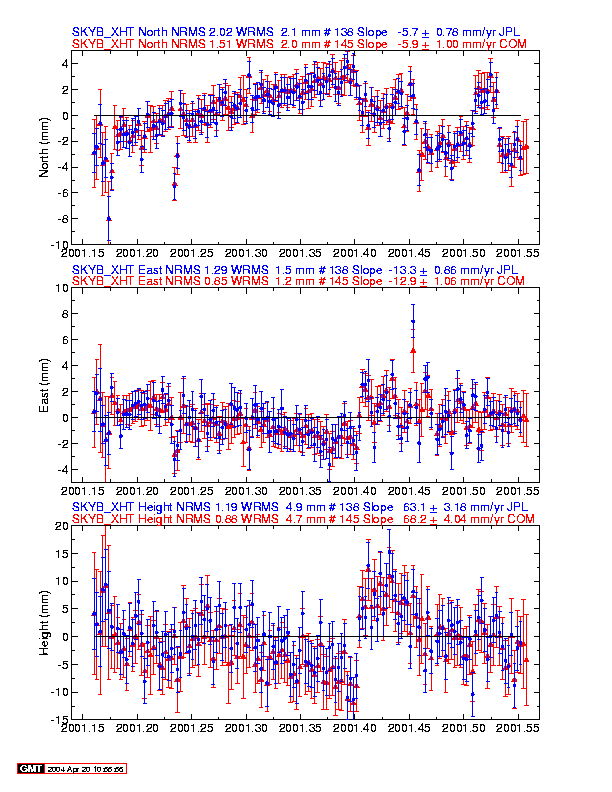
| 13 SKYB_XHT | SKYB_XHT_jpl.jpg | SKYB_XHT_sio.jpg | N | E | U |