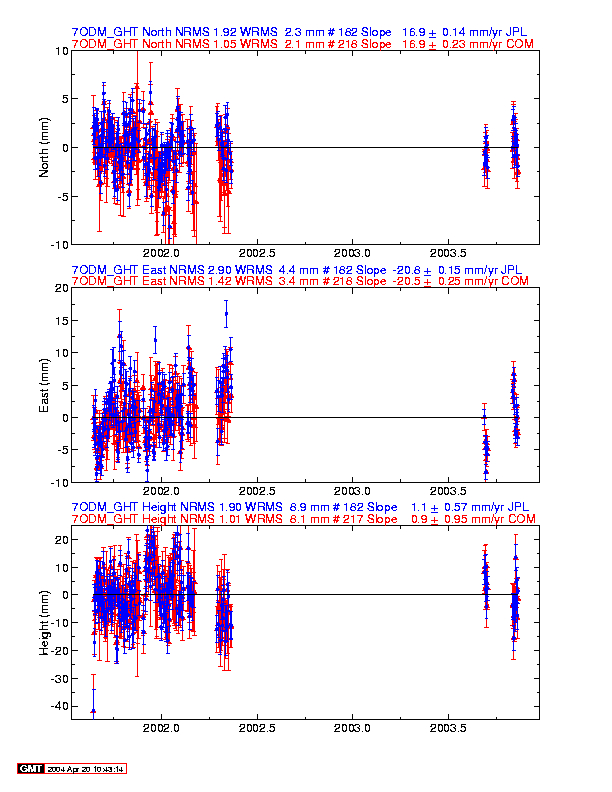
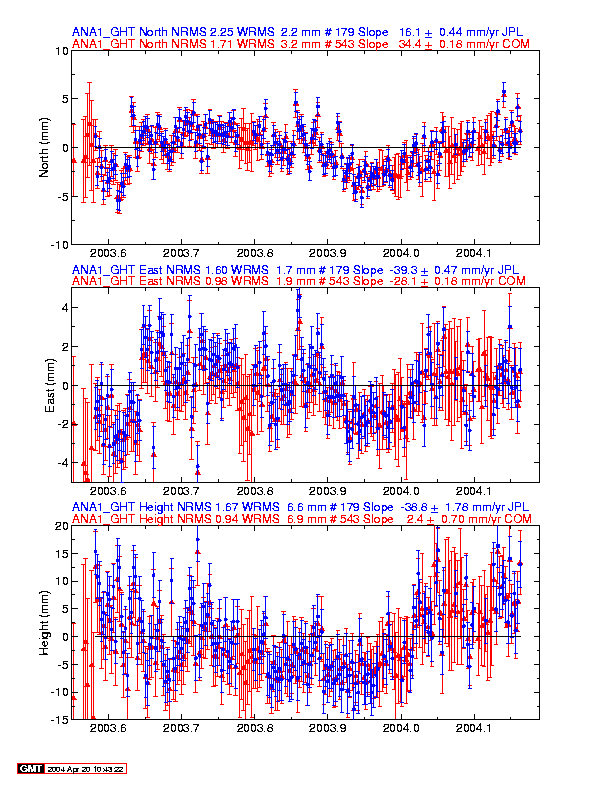
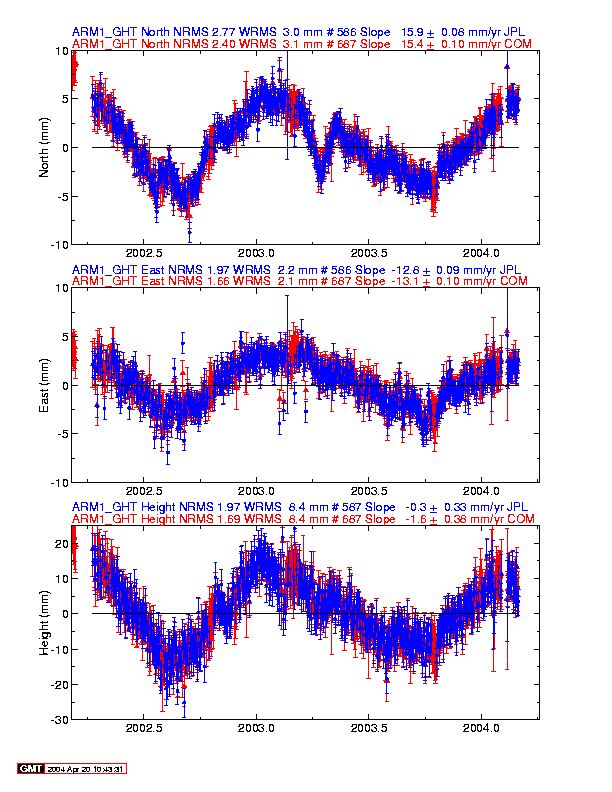
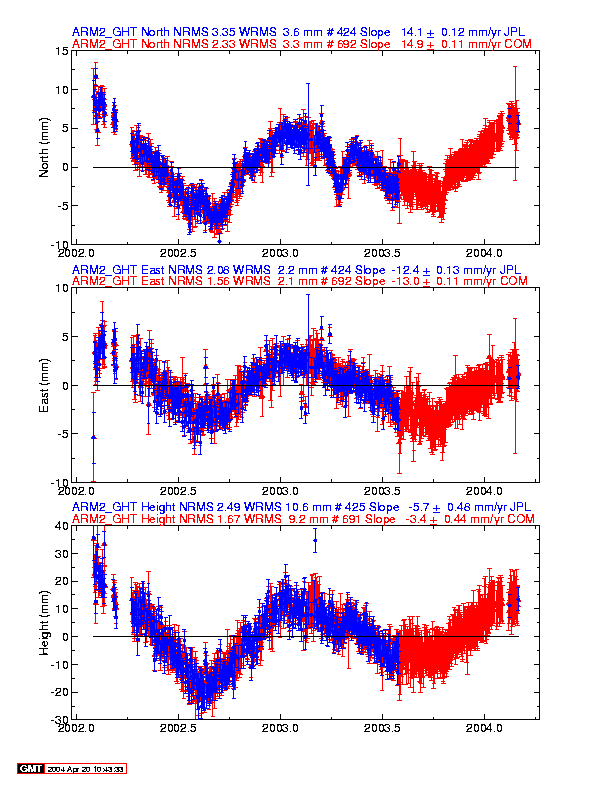
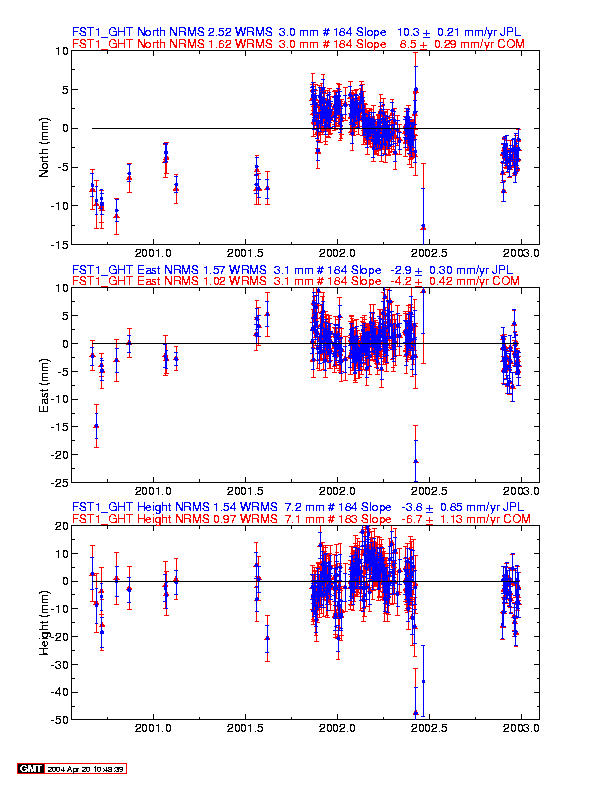
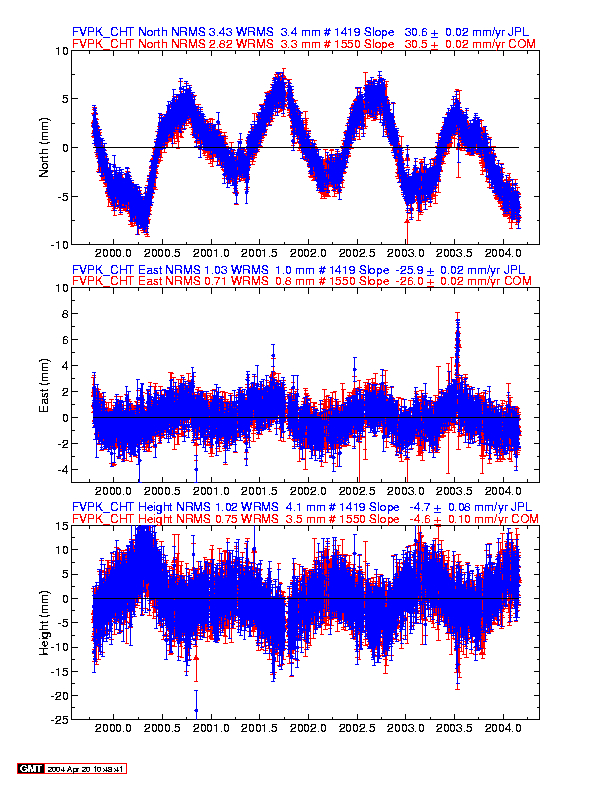
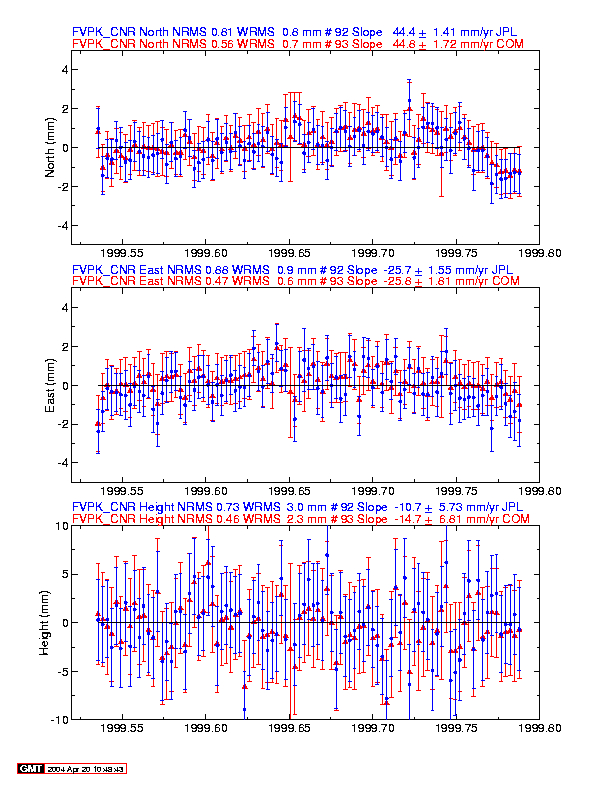
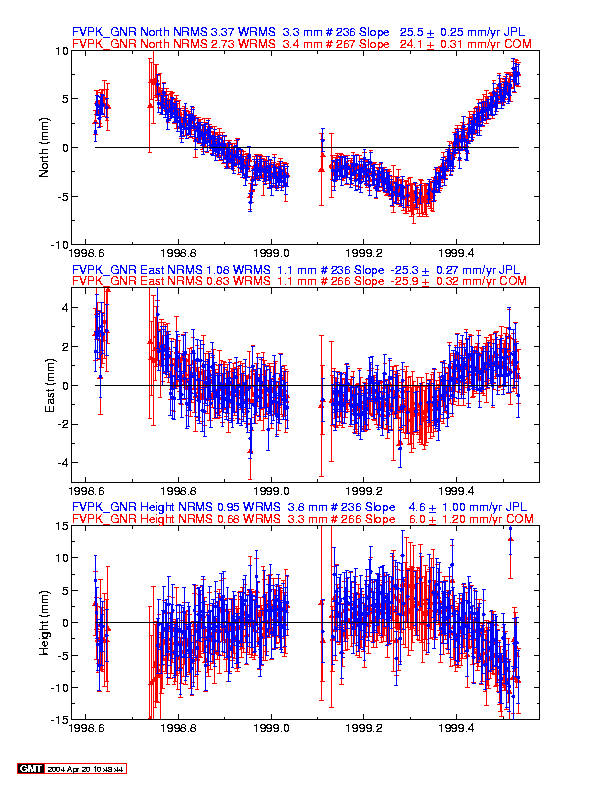
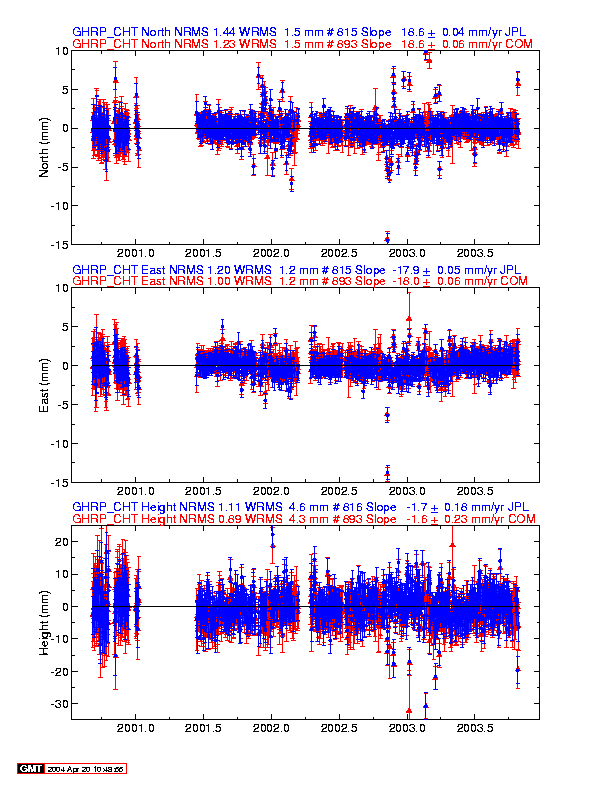
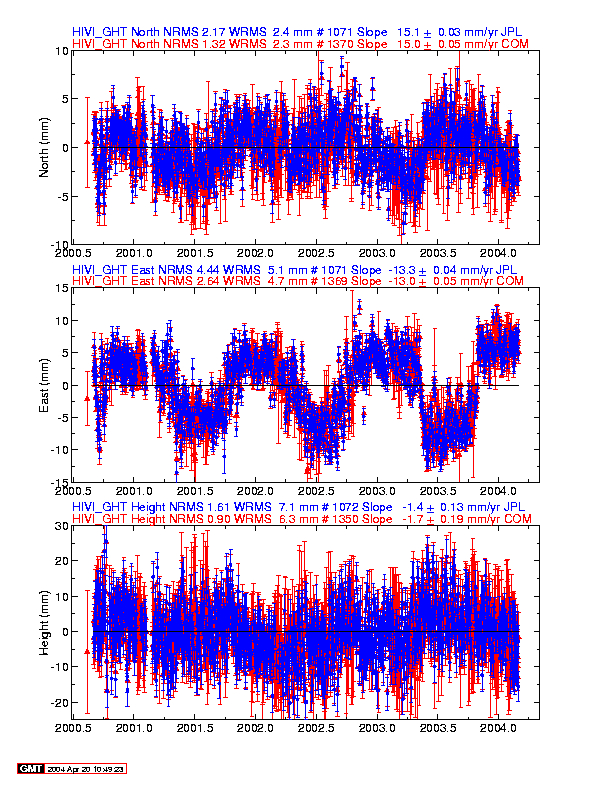
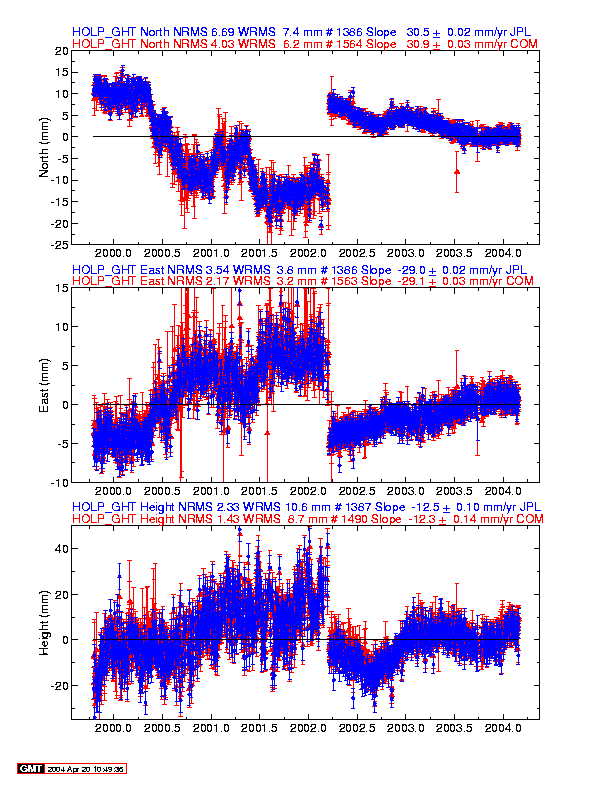
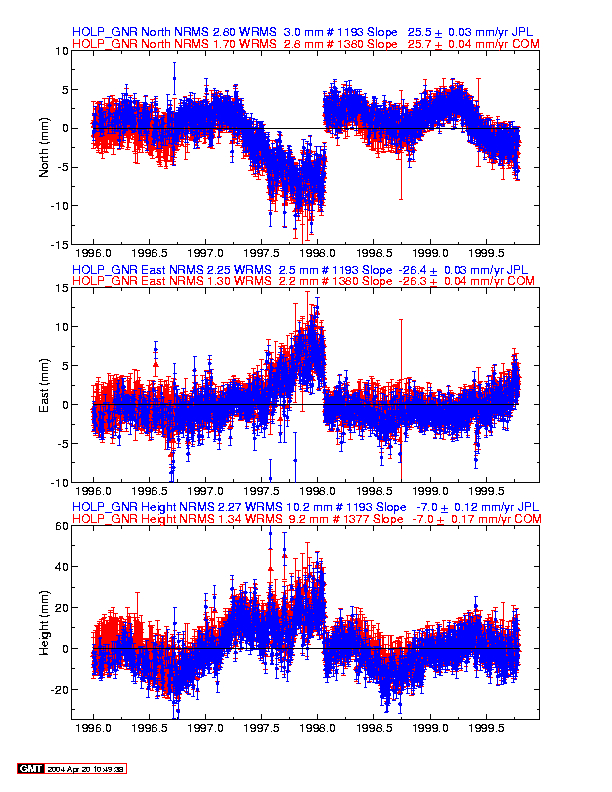
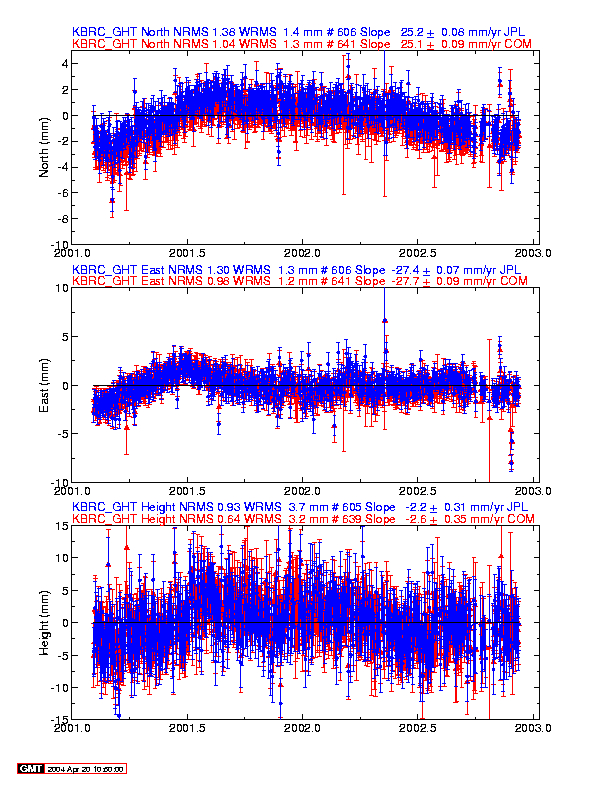
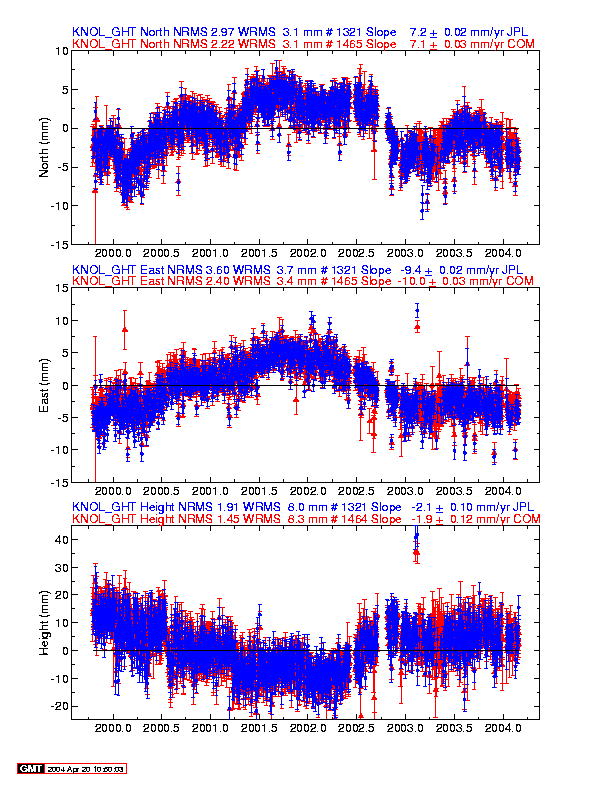
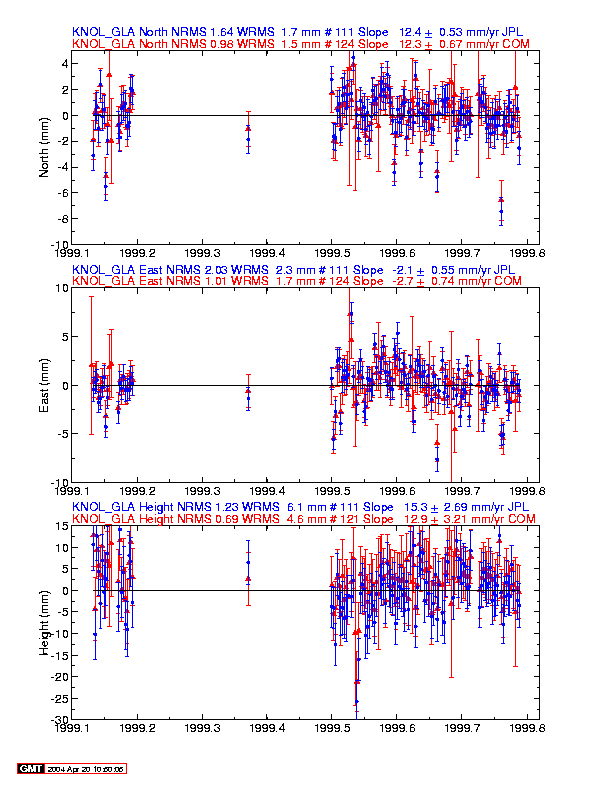
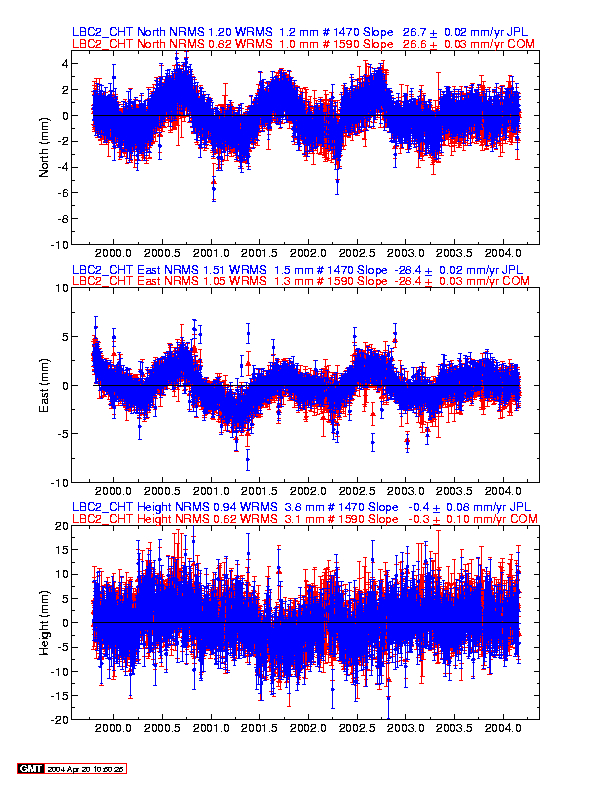
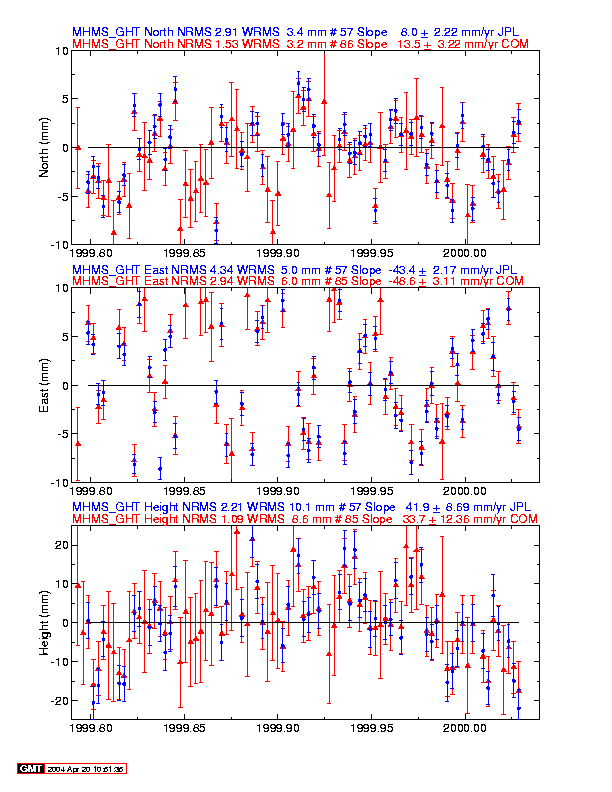
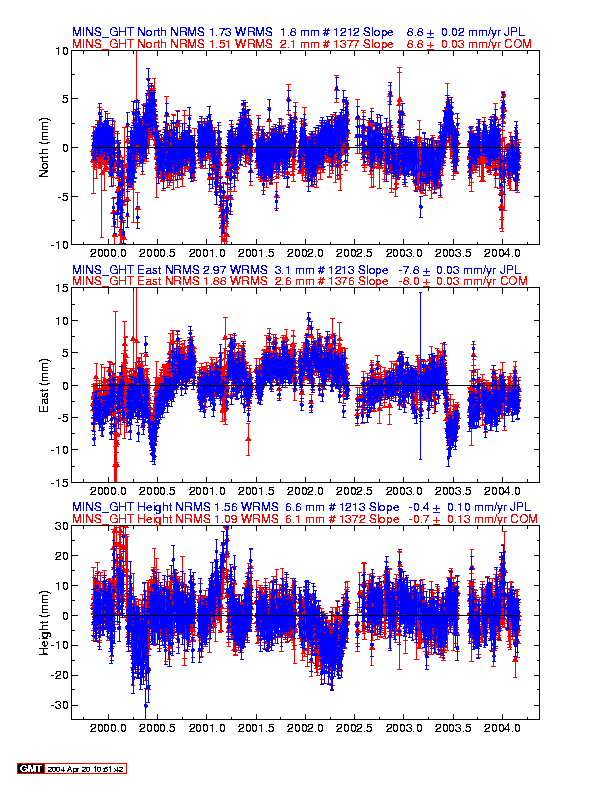
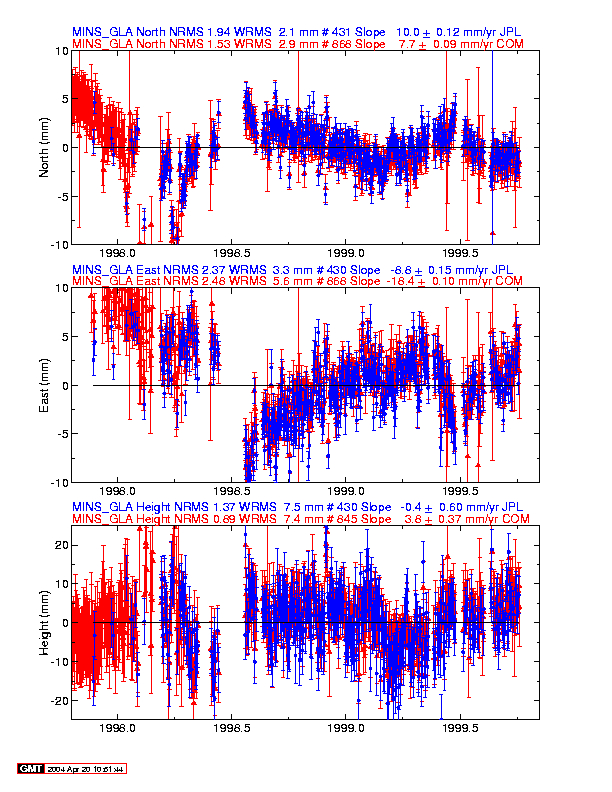
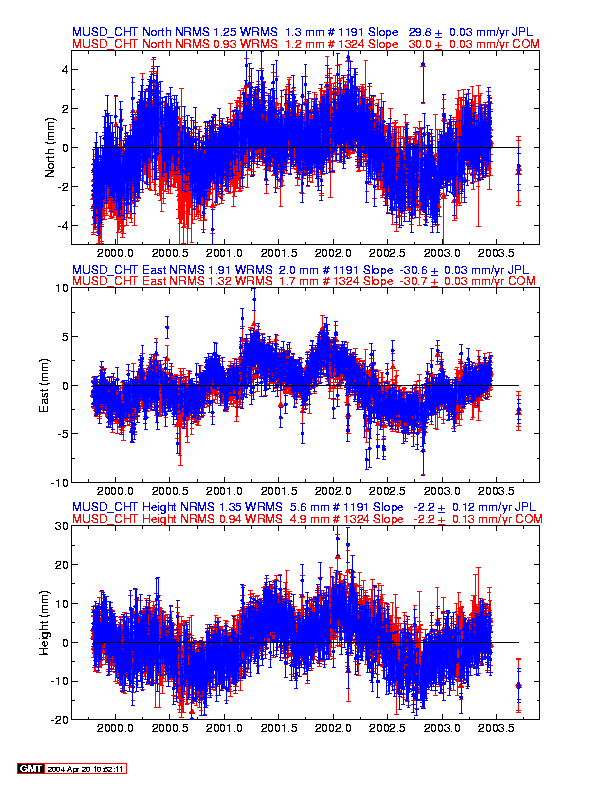
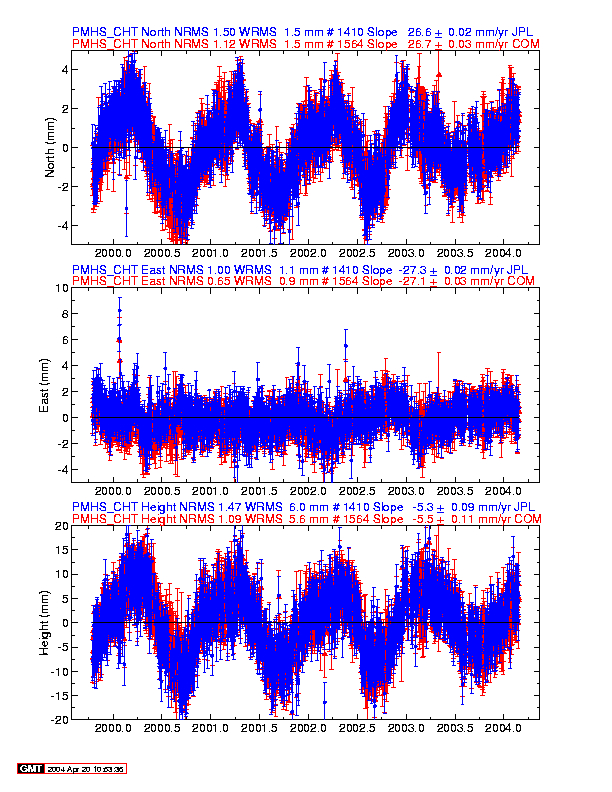
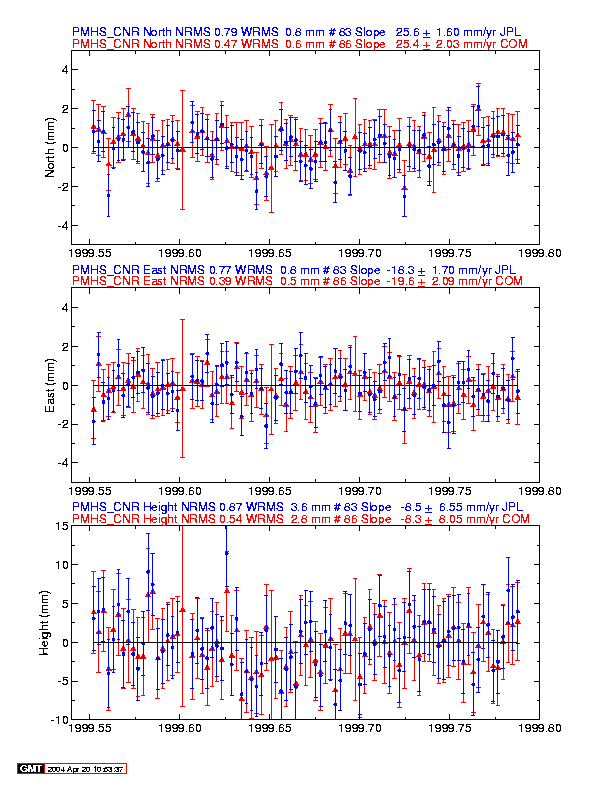
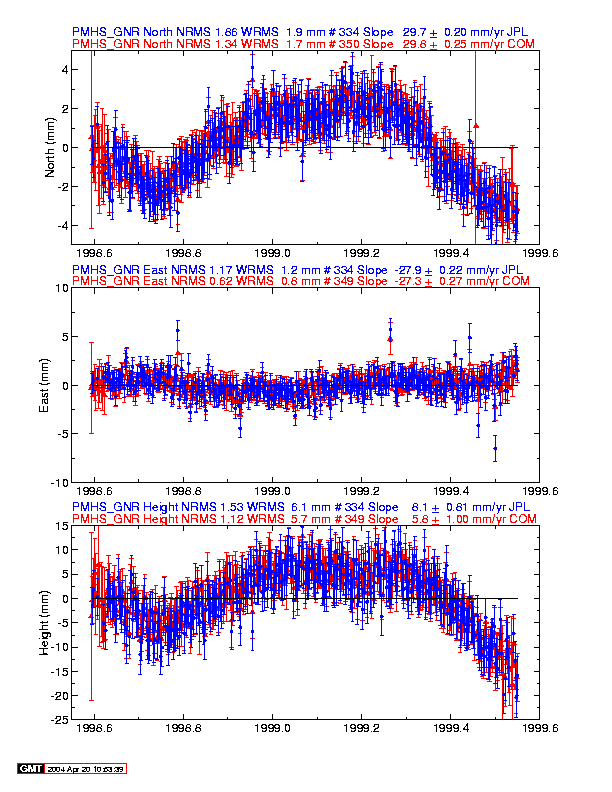
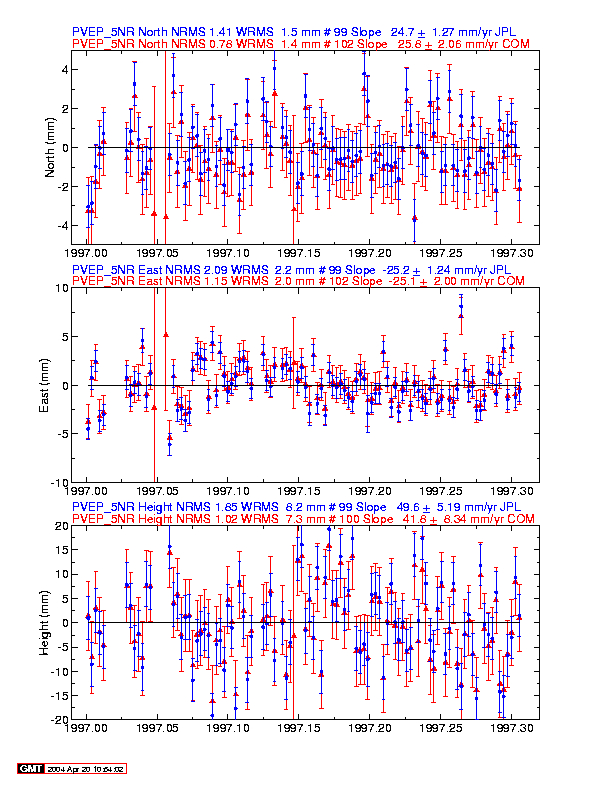
Other site time series plots
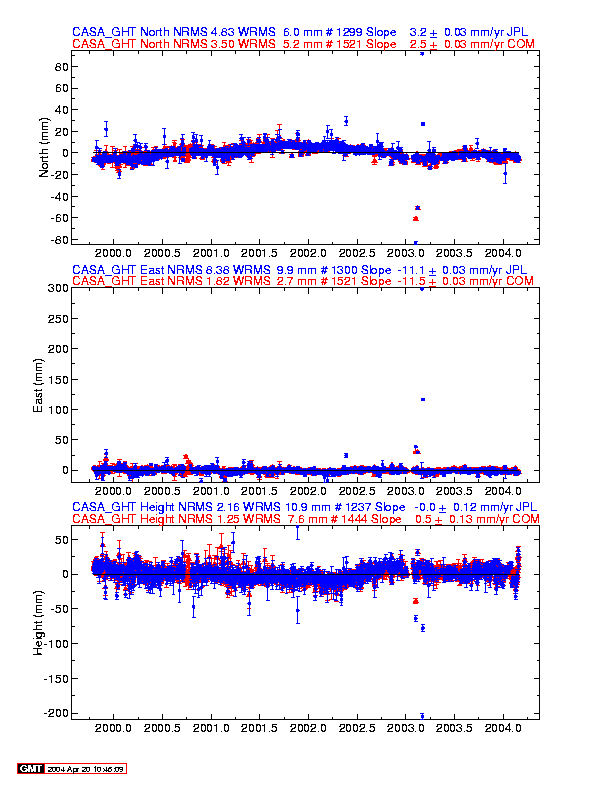
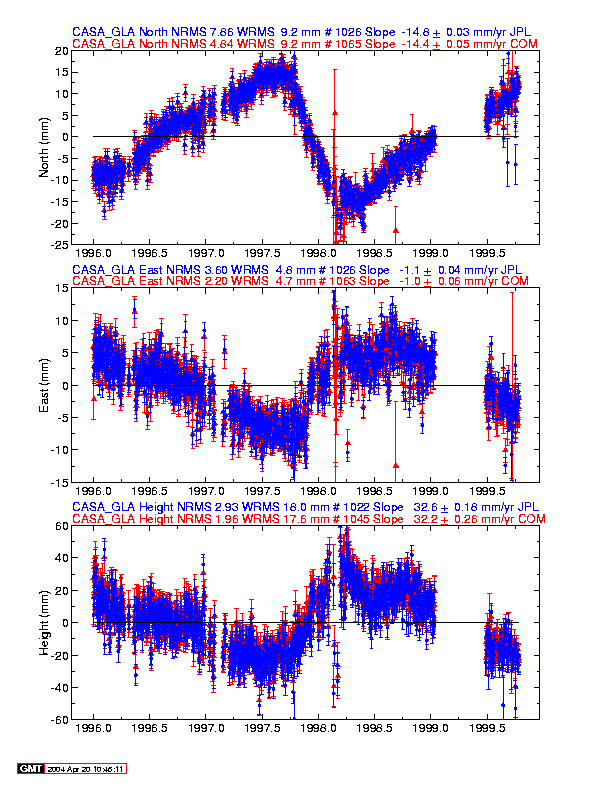
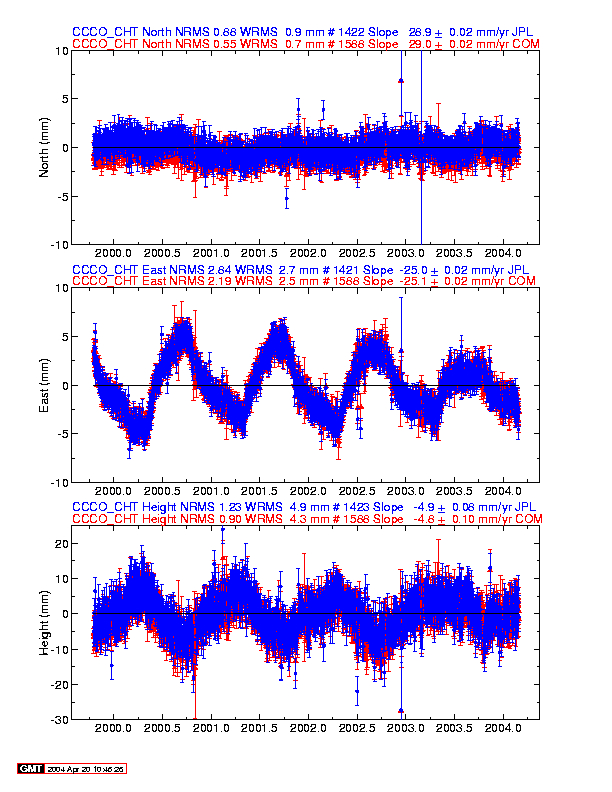
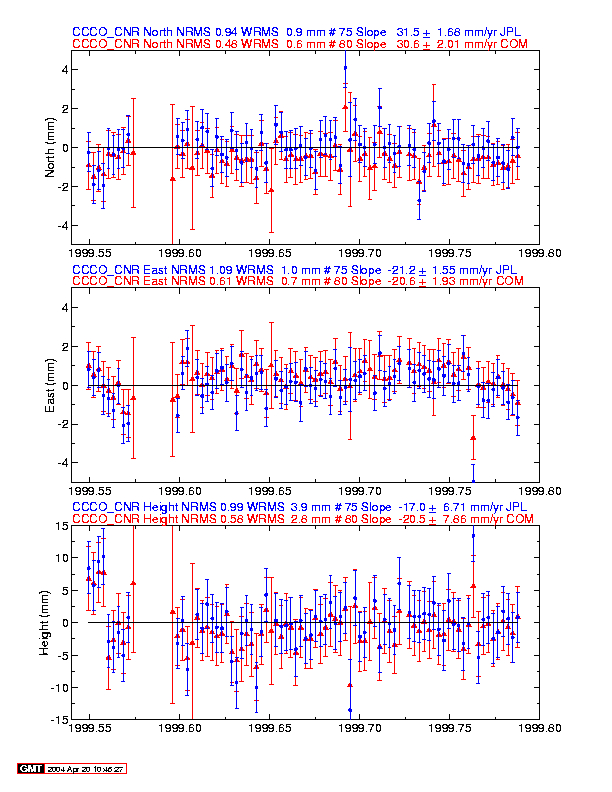
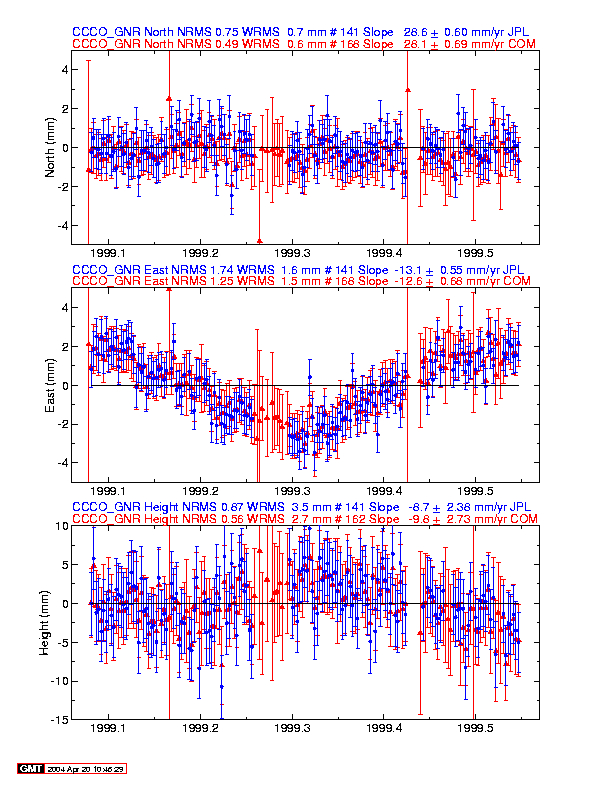
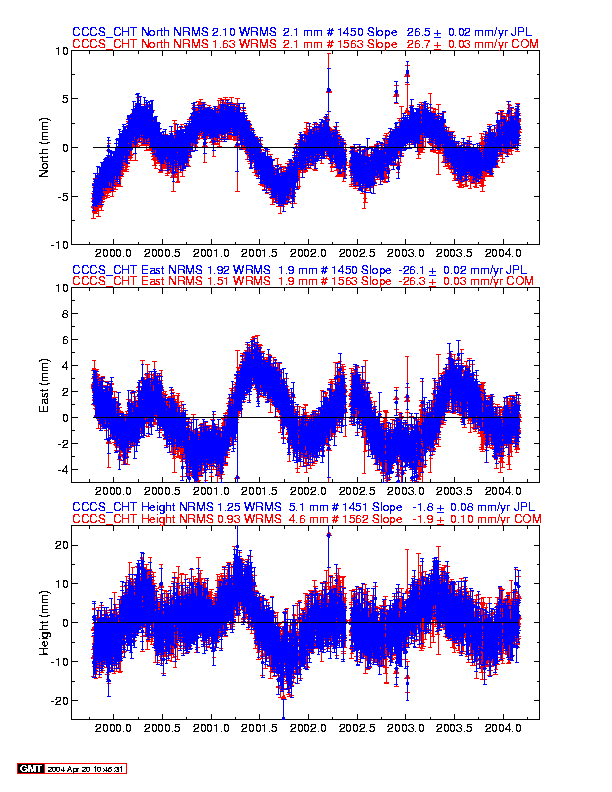
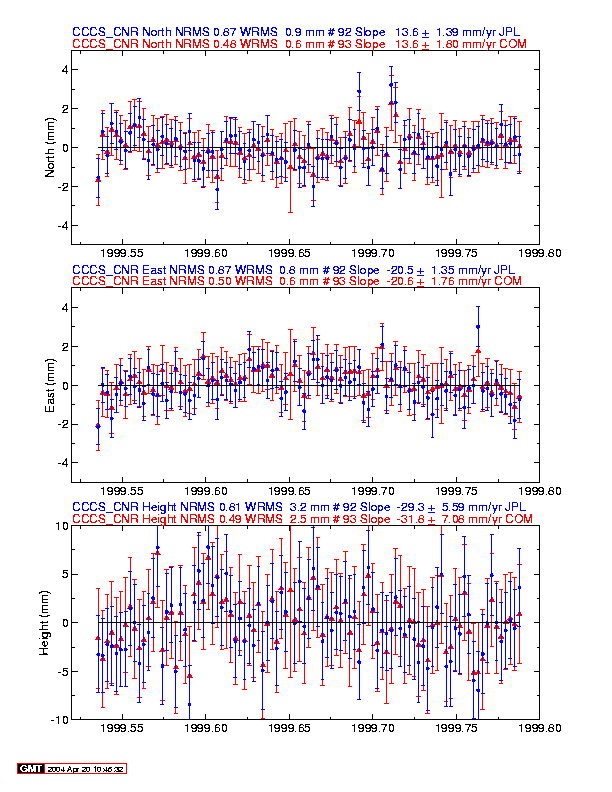
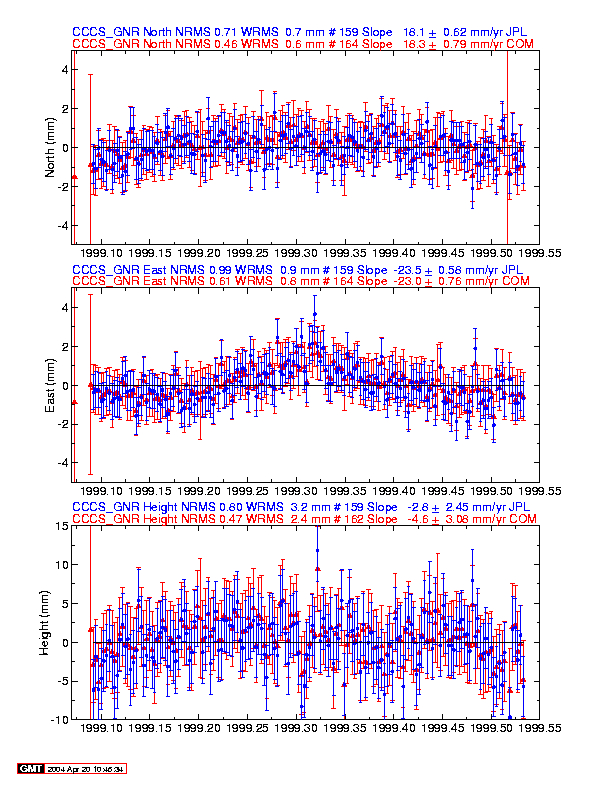
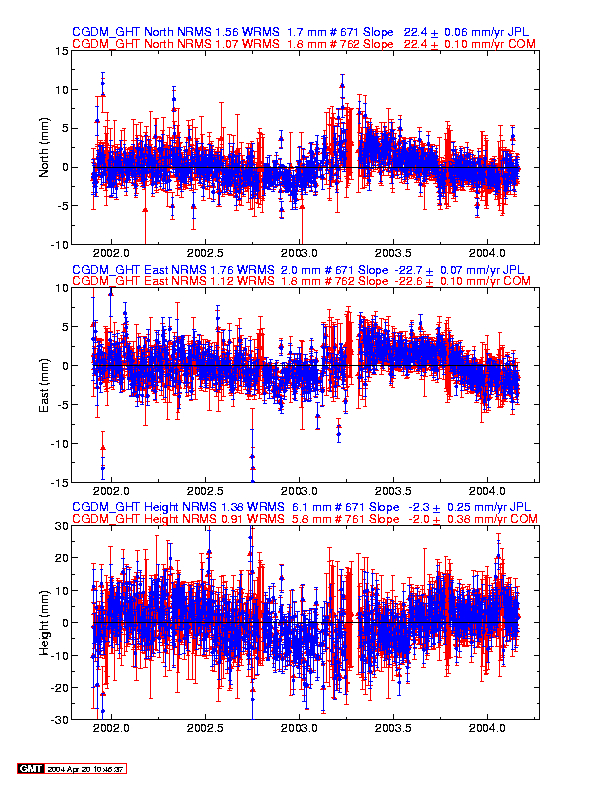
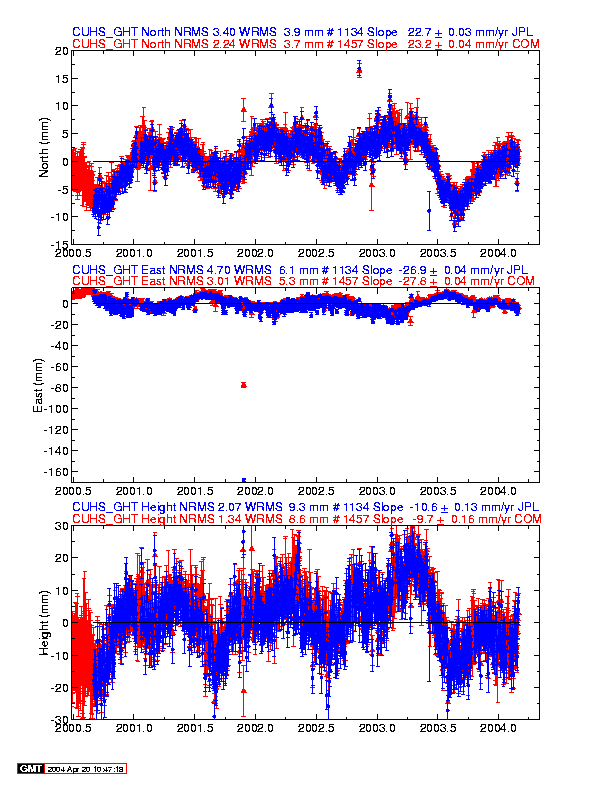
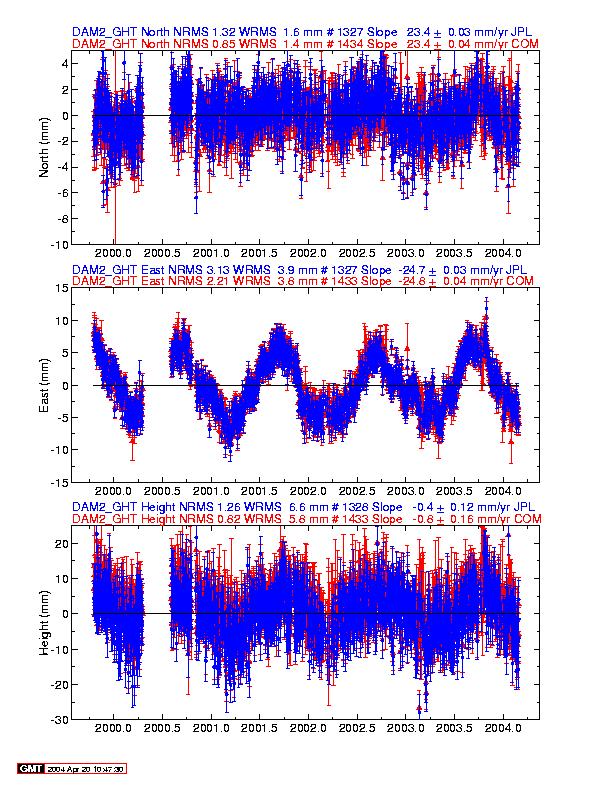
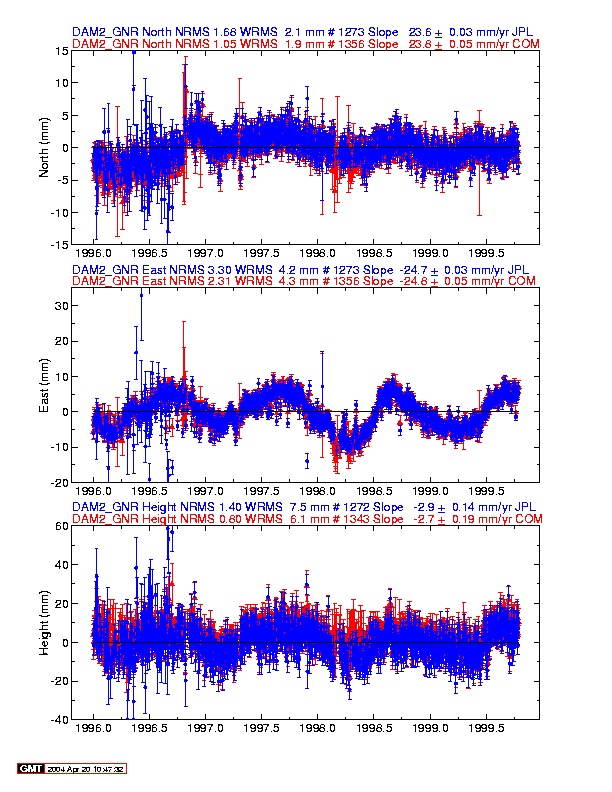
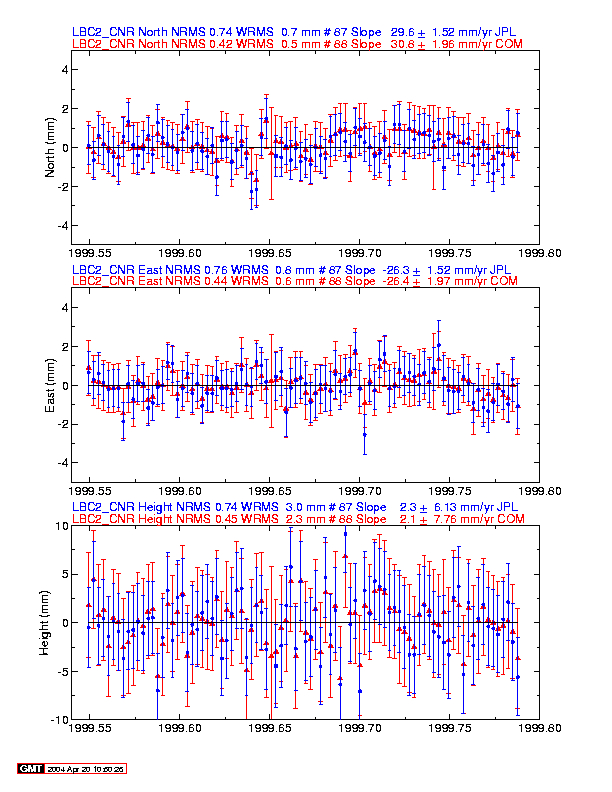
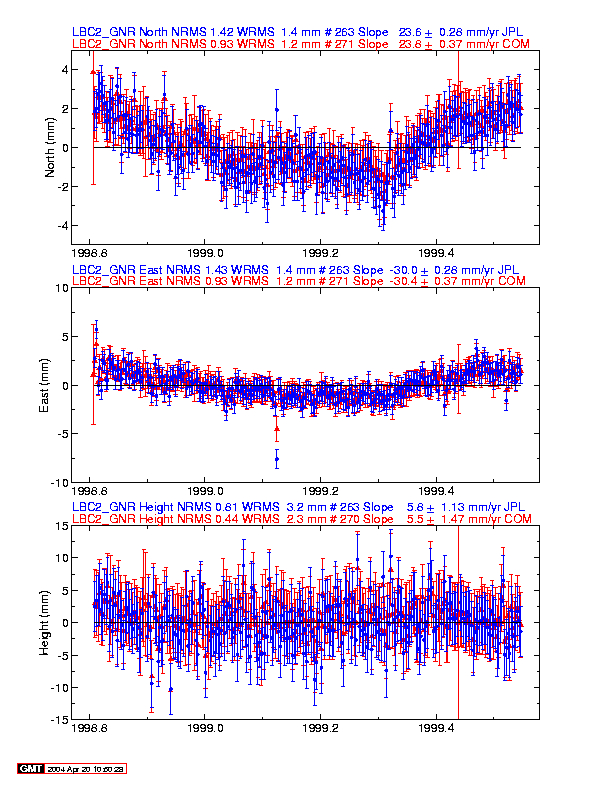
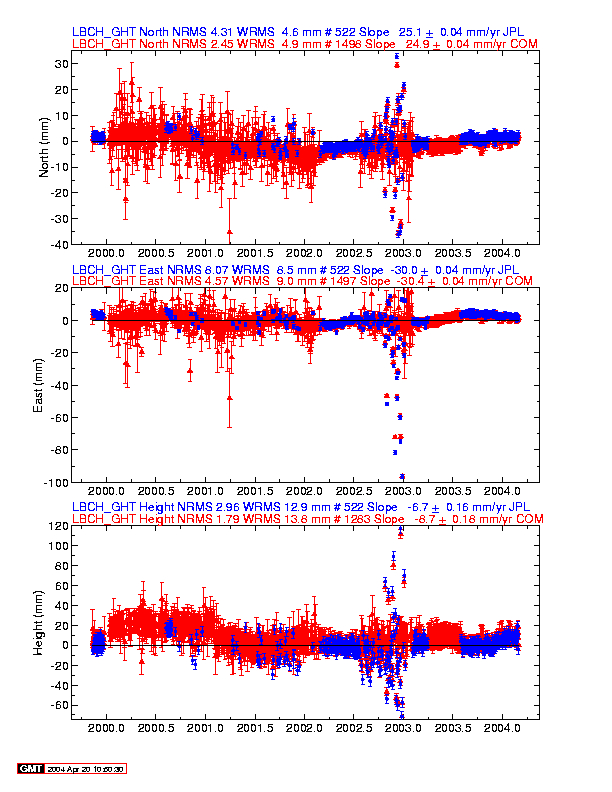
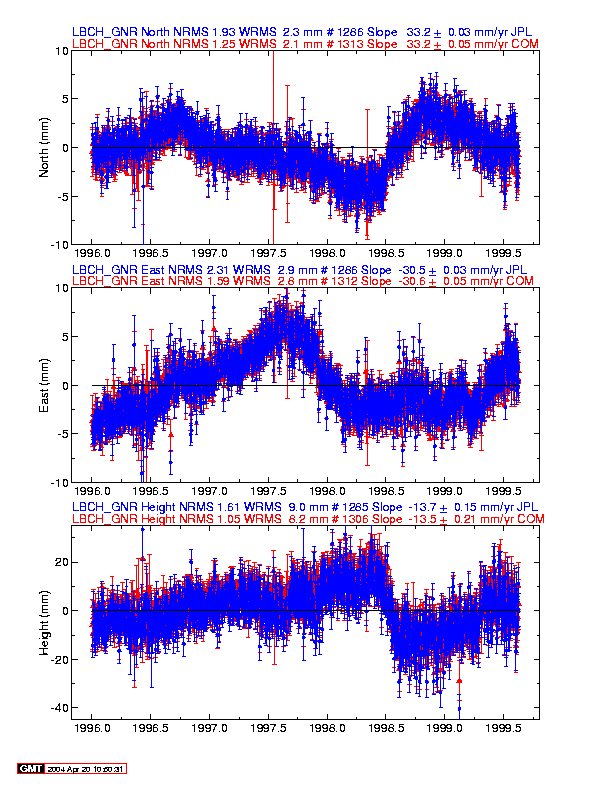
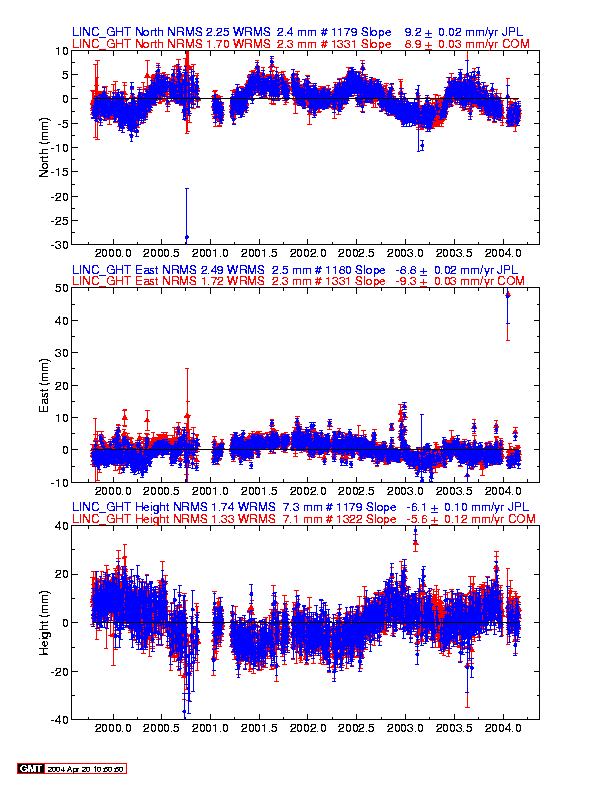
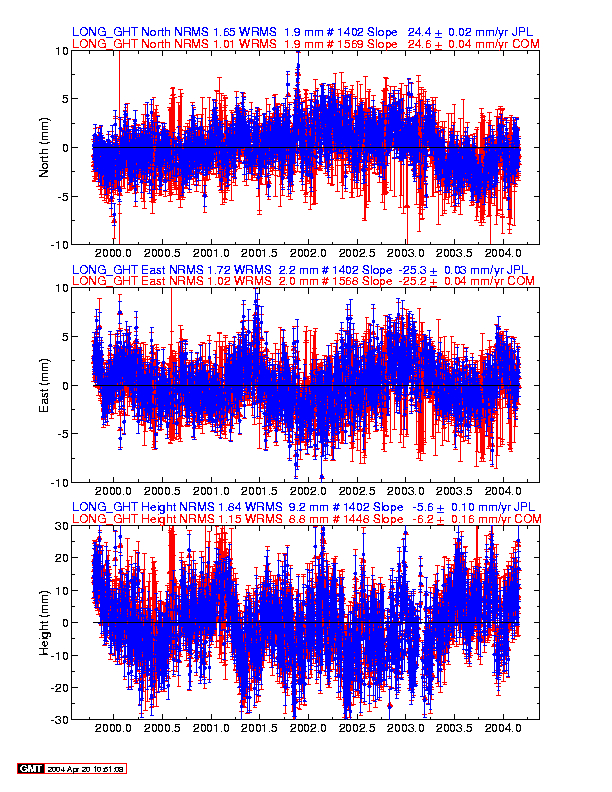
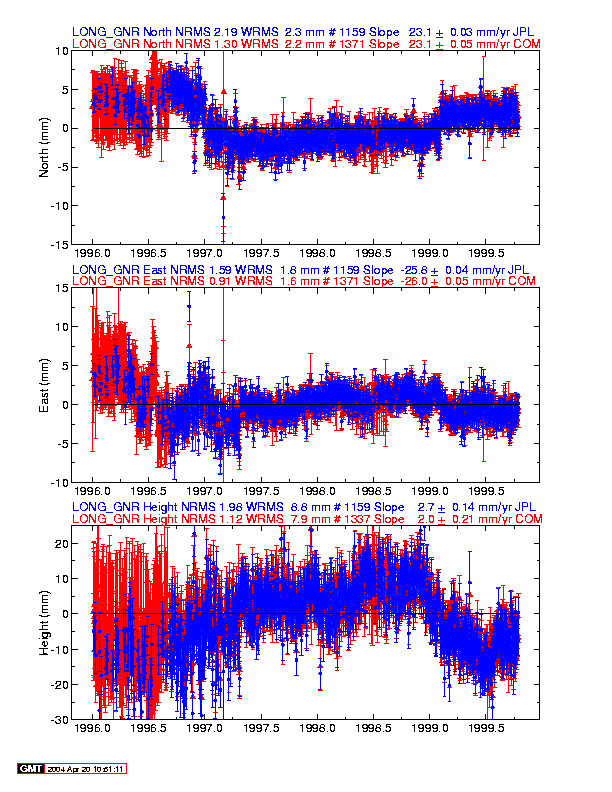
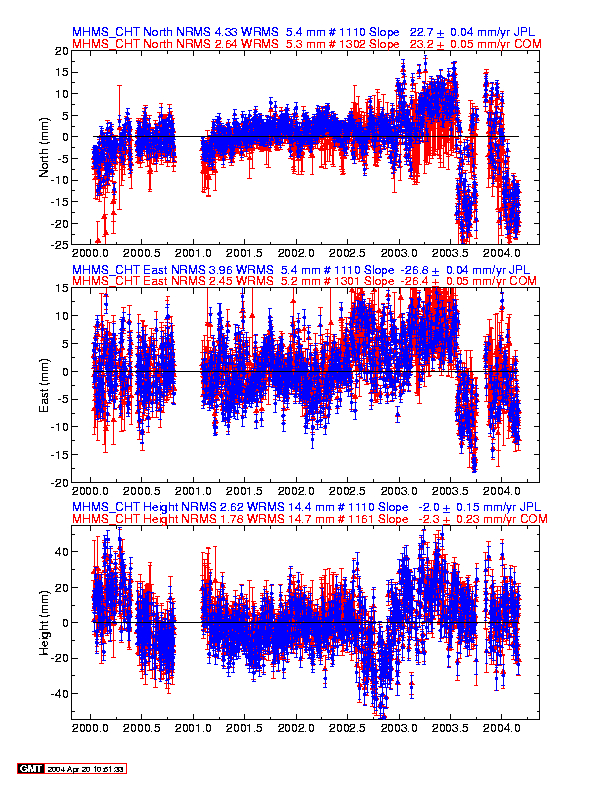
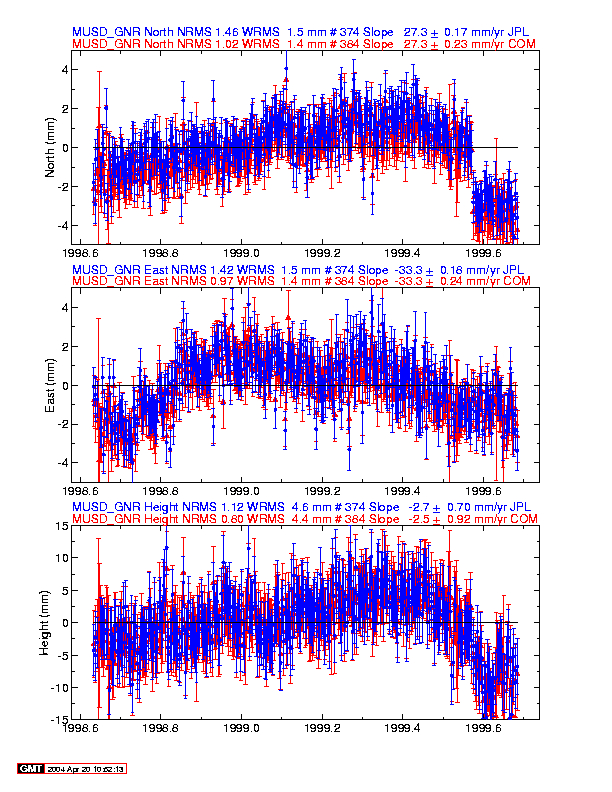
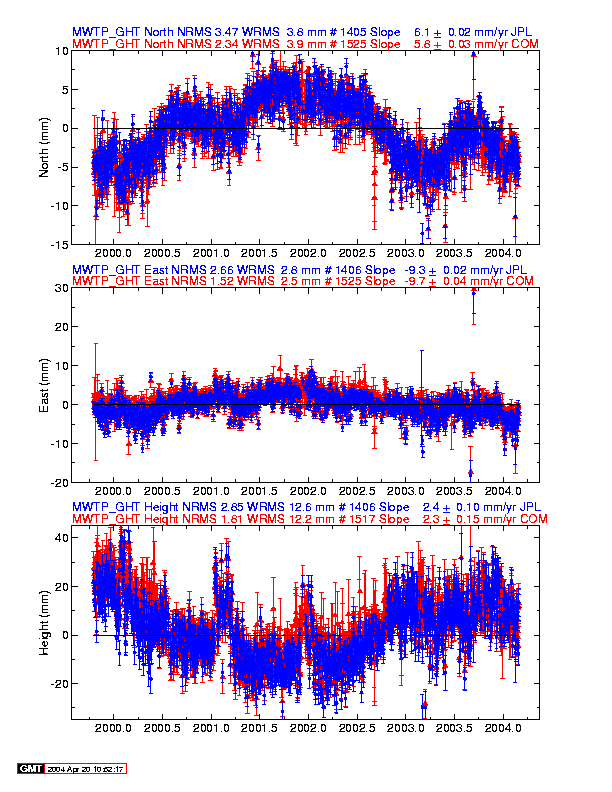
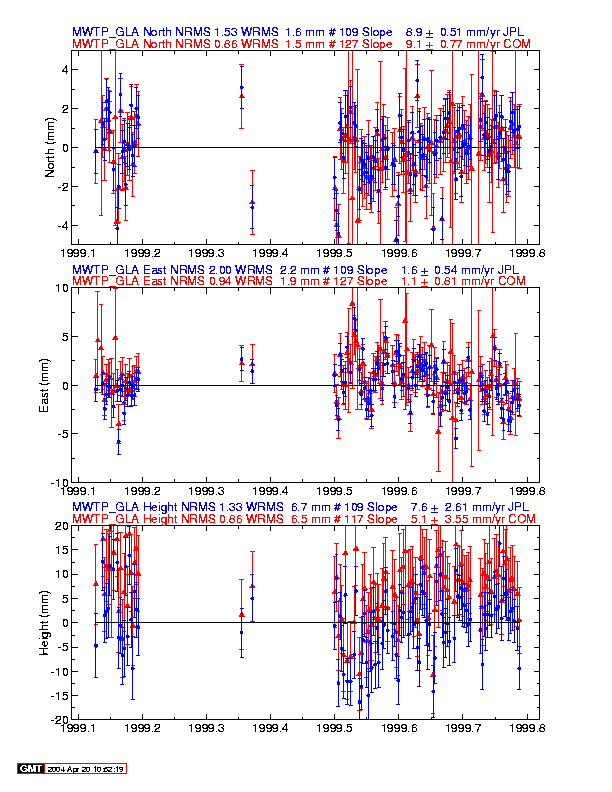
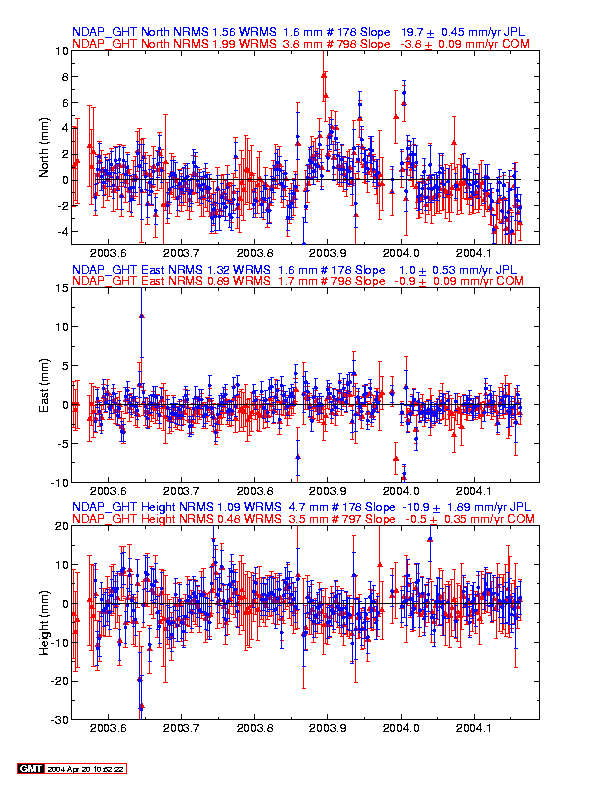
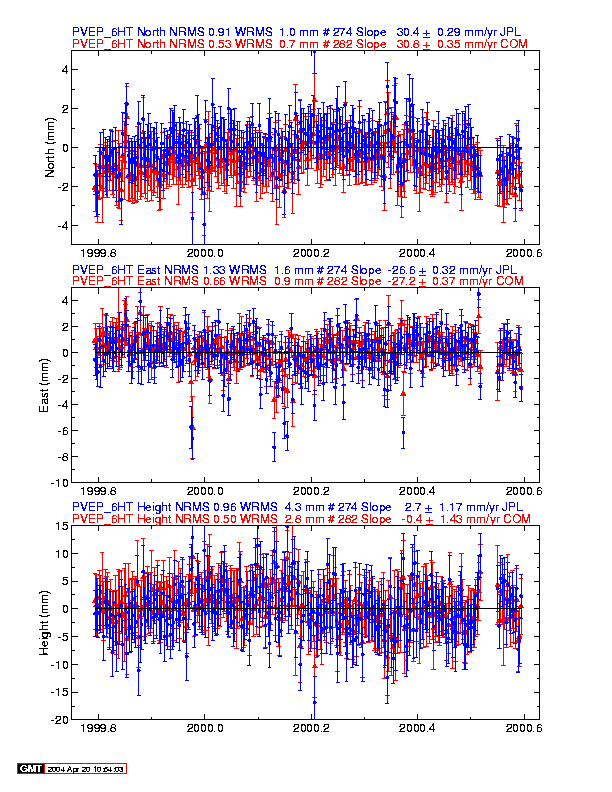
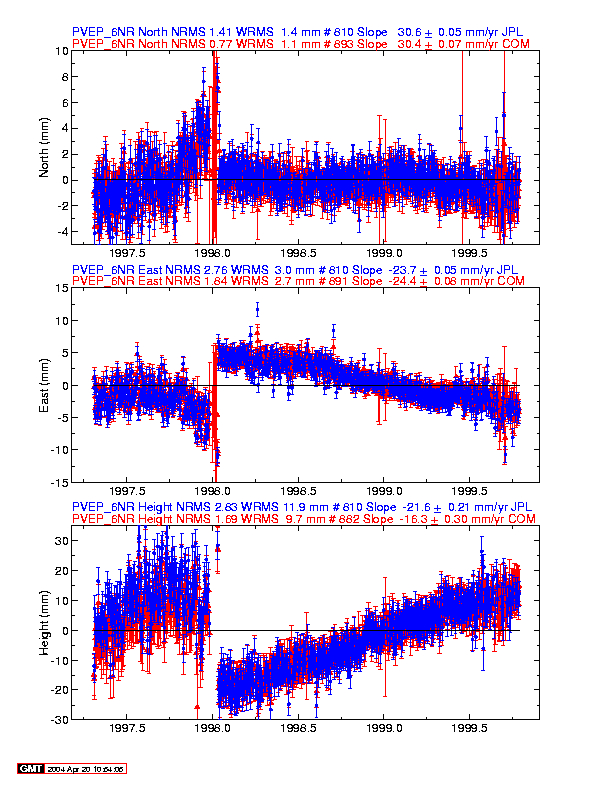
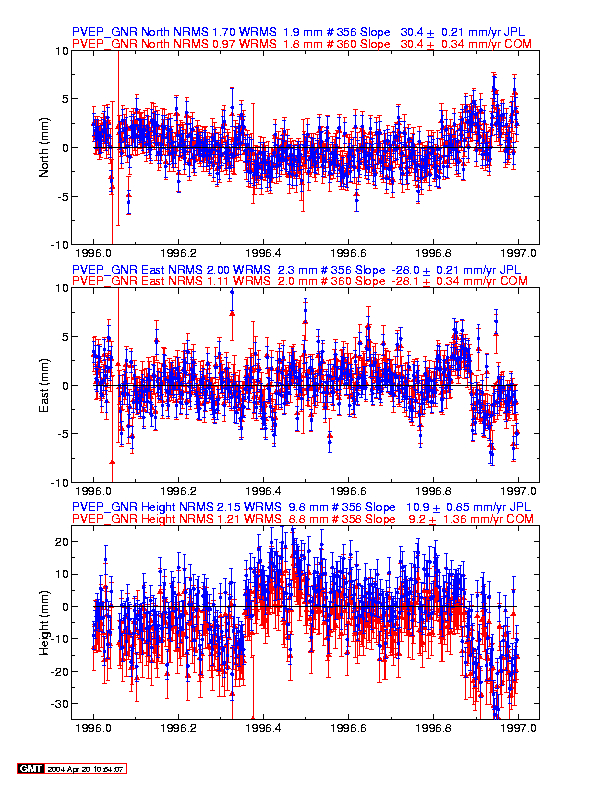
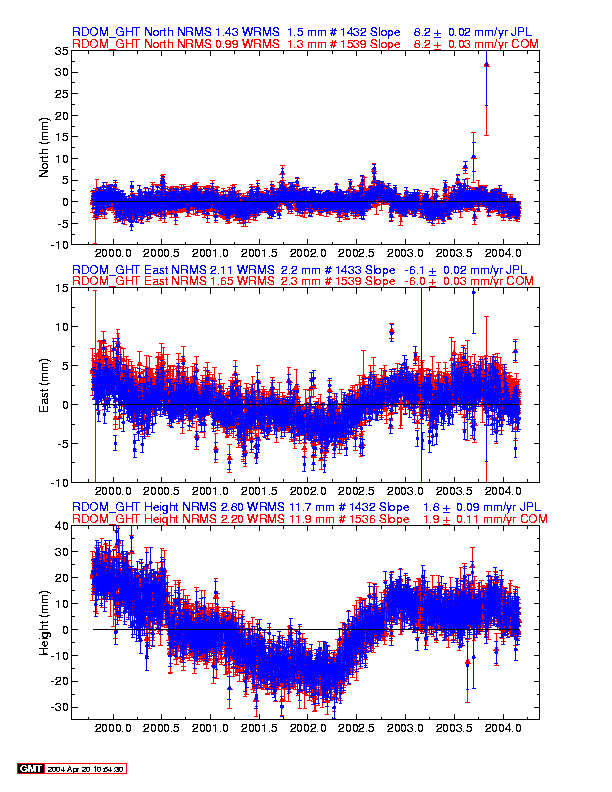
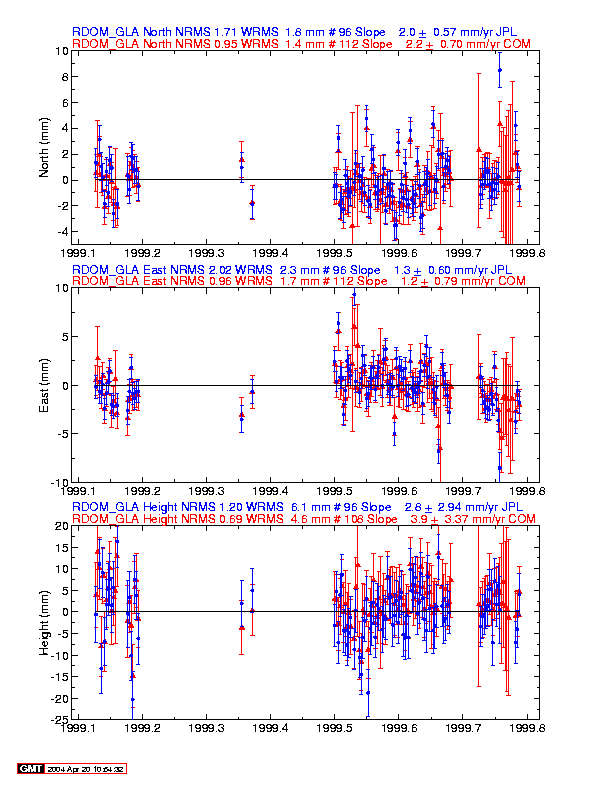
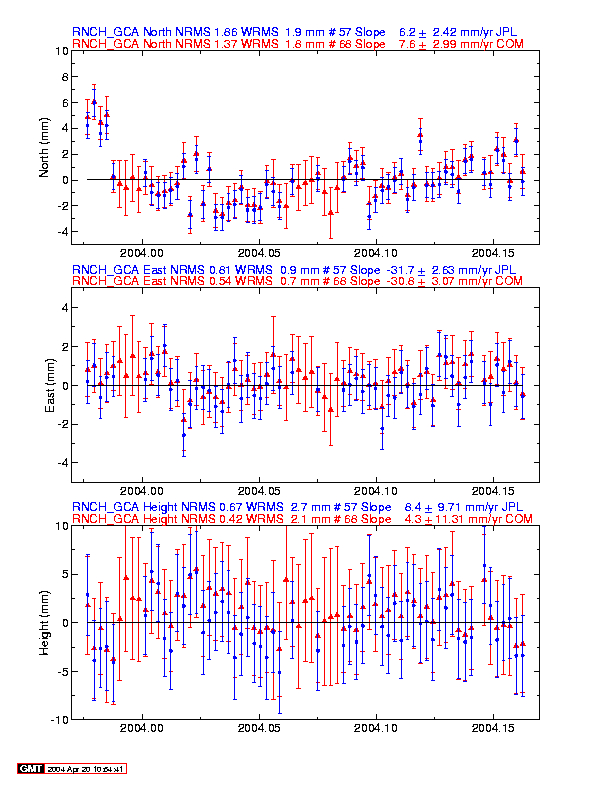
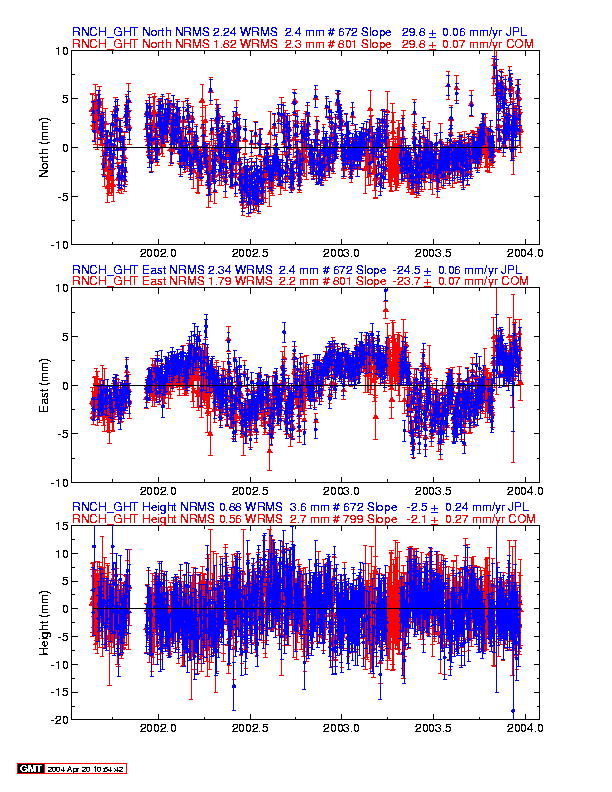
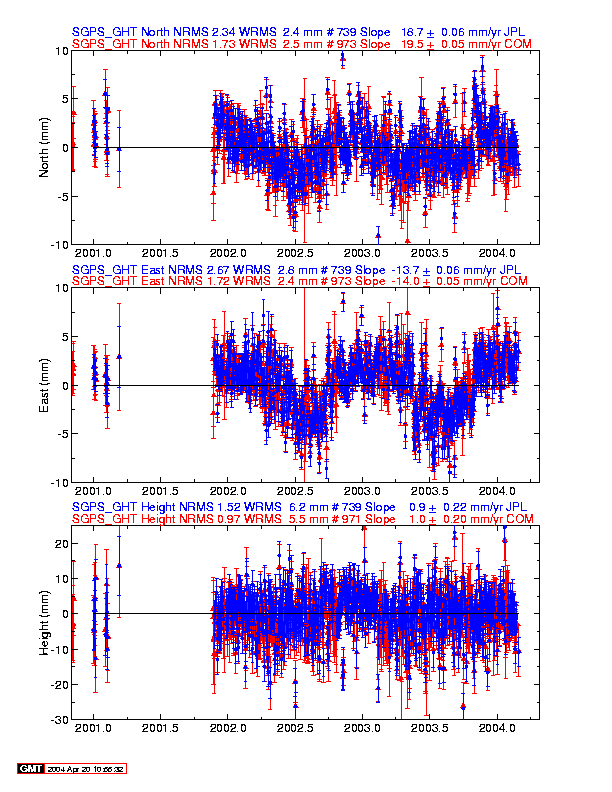
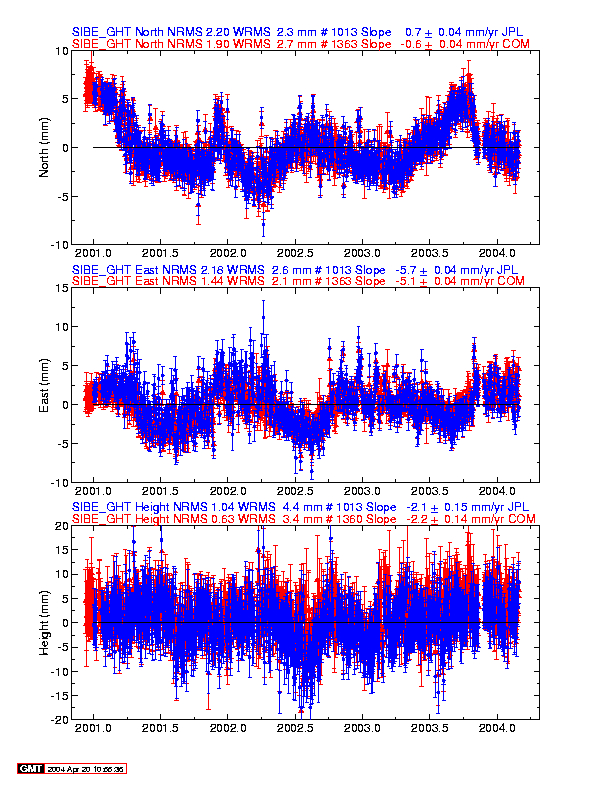
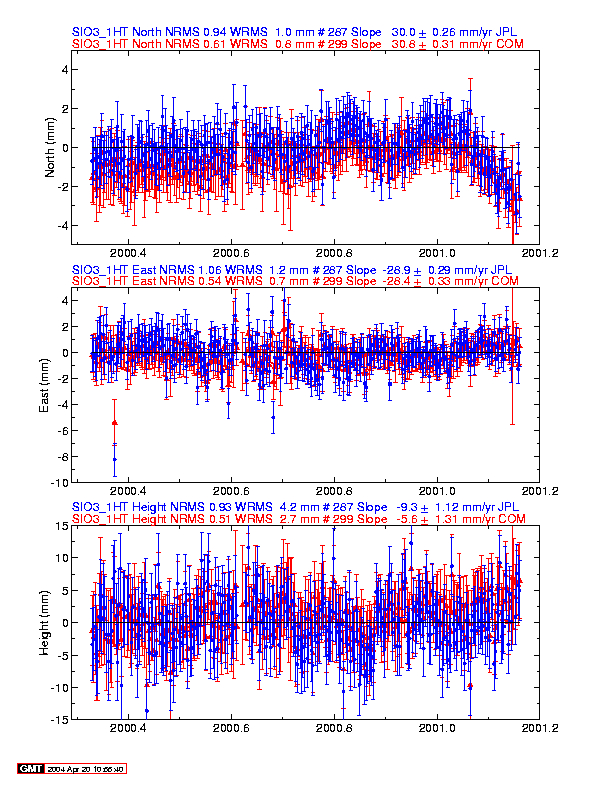
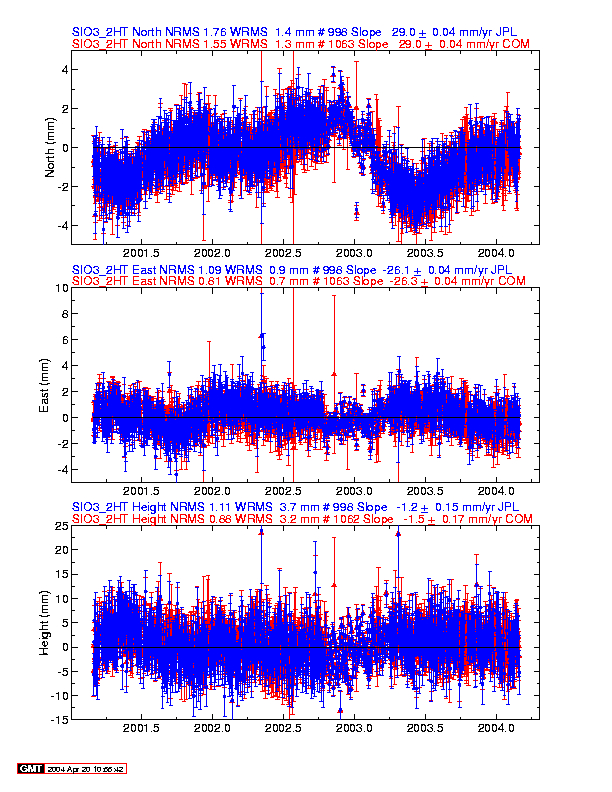
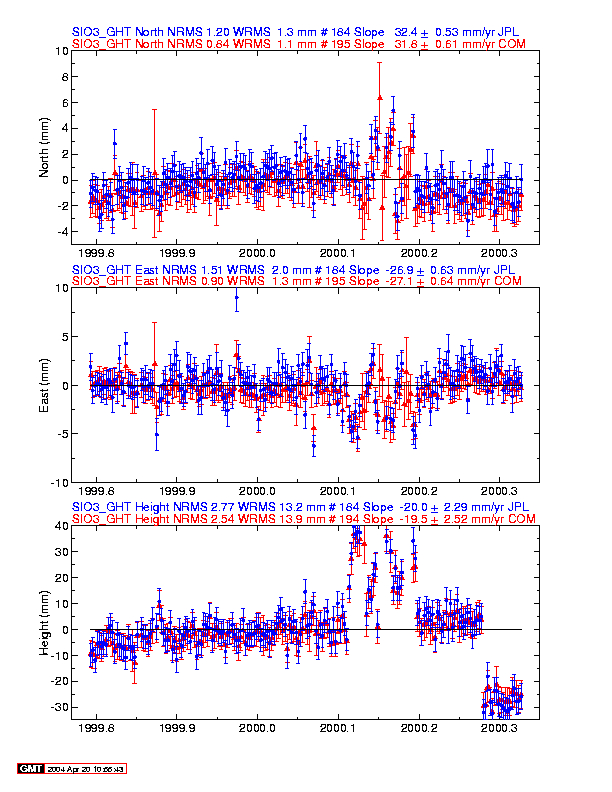
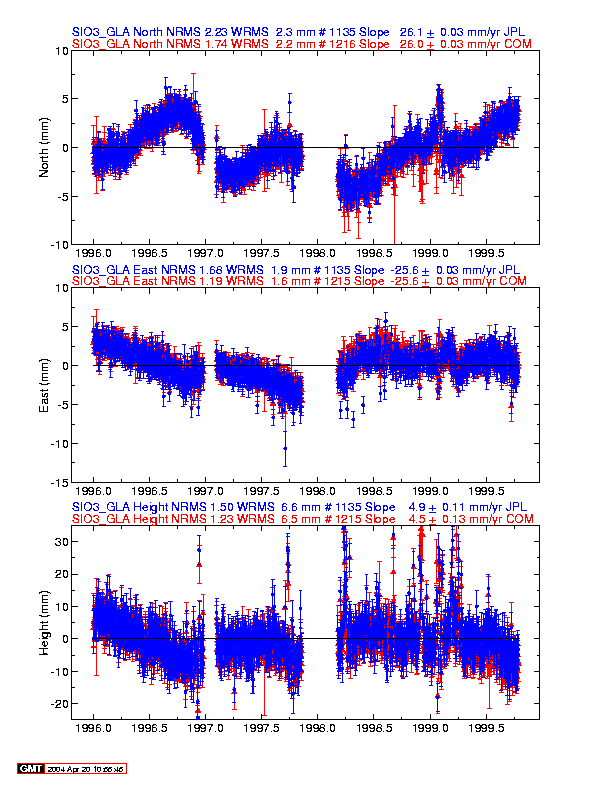
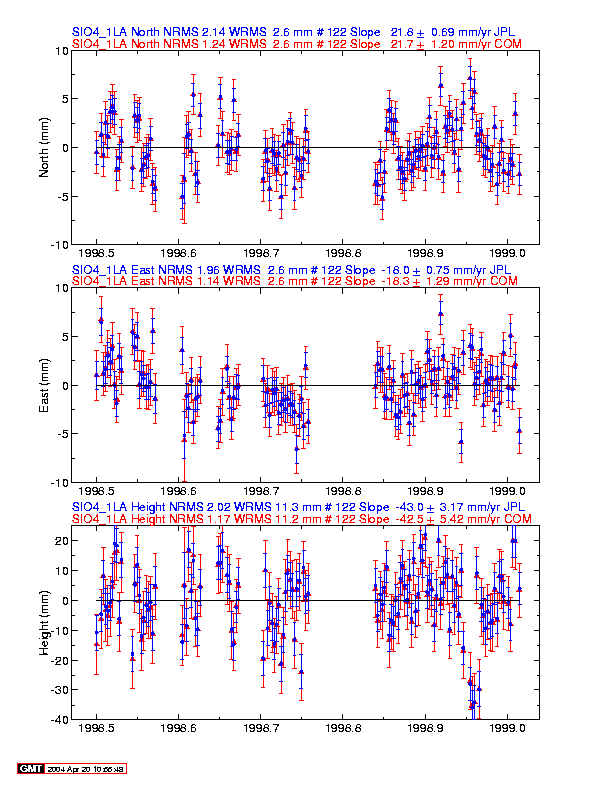
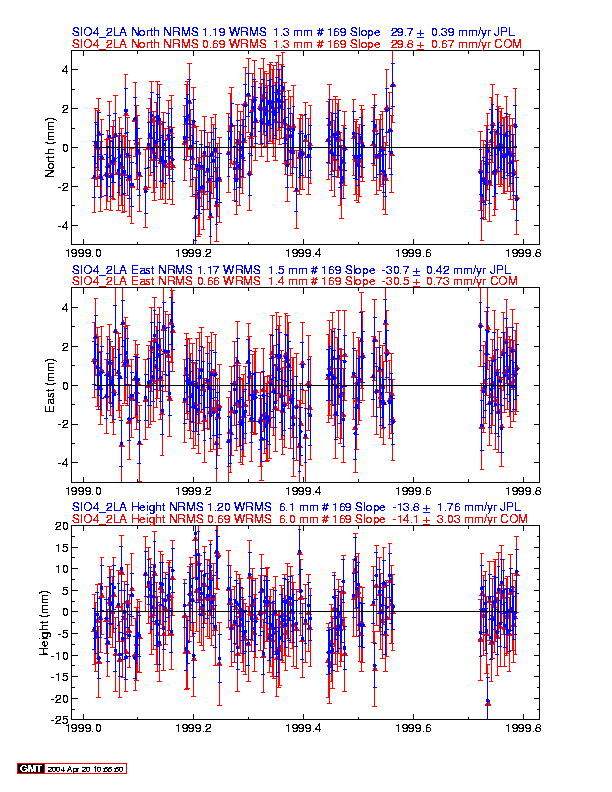
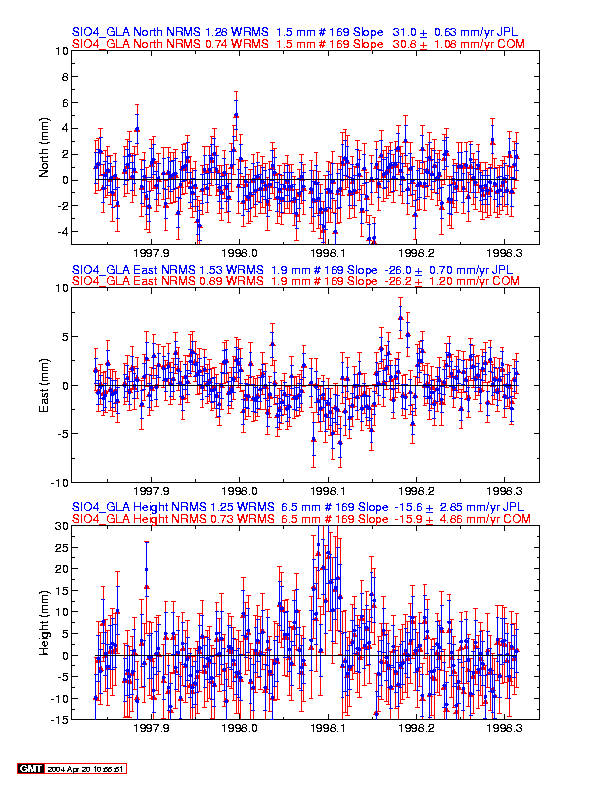
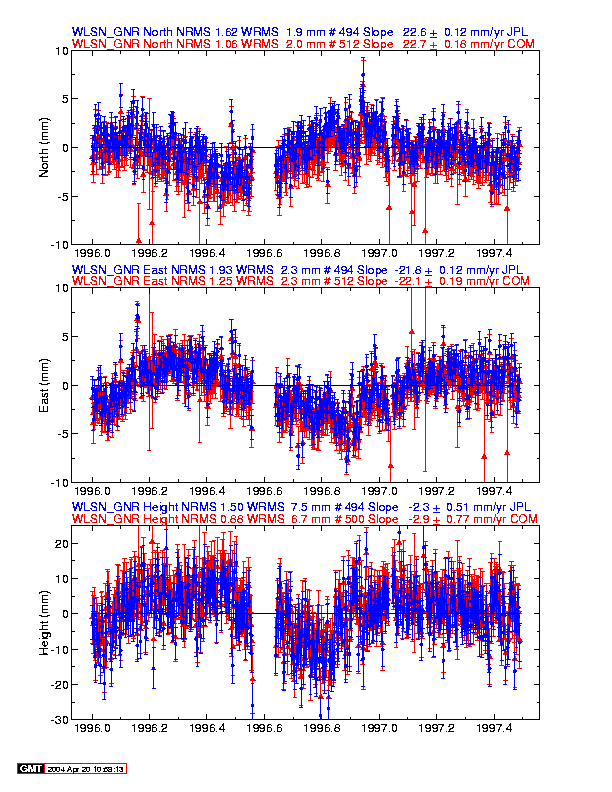
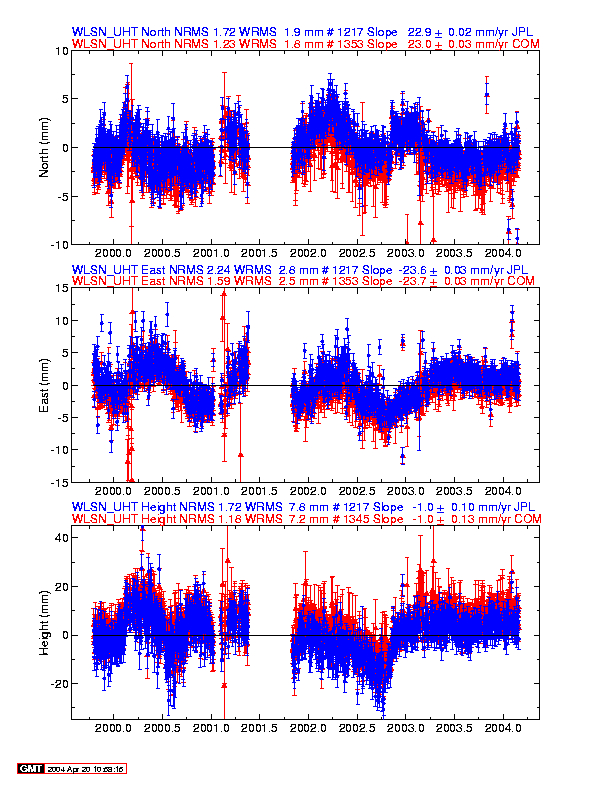
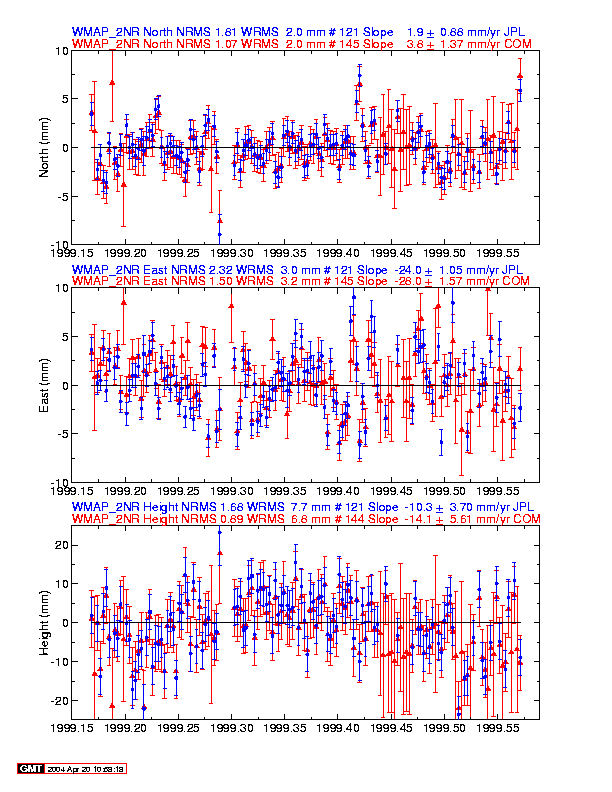
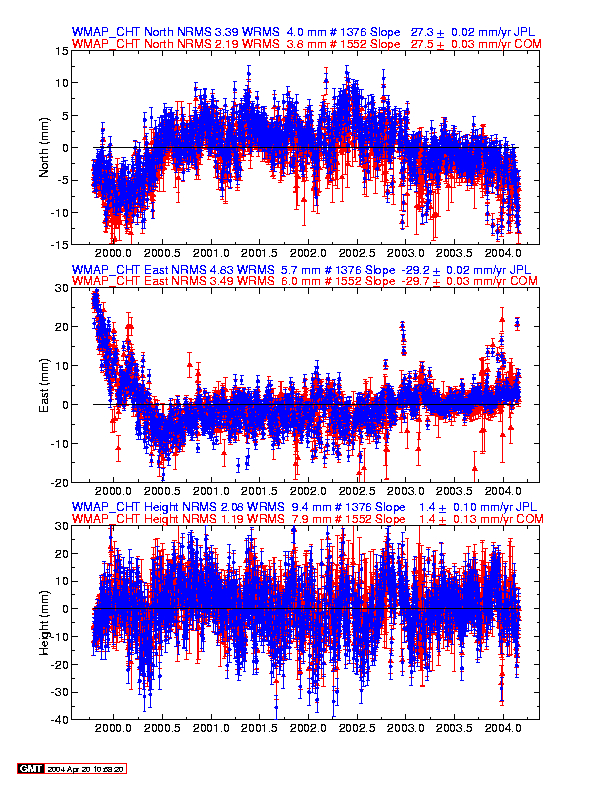
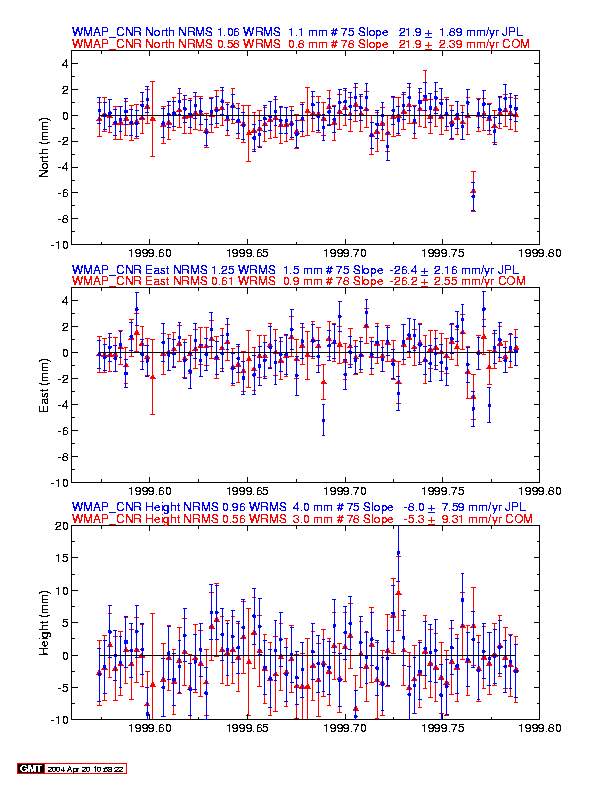
In the plots under JPL and SIO, the red symbols are from the combined time series
analysis and the blue symbols are for either JPL or SIO. The sigmas shown on the plots
are white noise sigmas and are underestimates.
These sites show sufficient non-linear variation that they are not included
in the Kalman filter forward solution. Their velocities are only available in the time
series velocity and log files.